Reviewed learning material · Video analysis · EnglishRead the full overview
This segment begins with the weather example to introduce mutual information intuitively, then defines entropy, compares fair and biased coins to show entropy increases with distribution uniformity, gives the formal entropy formula H of X equals negative the sum over x of P of X times log base two of P of X, explains conditional entropy H of X given Y and mutual information I of X semicolon Y equals H of X minus H of X given Y using rectangle height differences, and finally visualizes the spatial relationships among H of X, H of Y, I of X semicolon Y, H of X given Y, H of Y given X, and joint entropy using a two-circle Venn diagram.
This 95-second clip explains mutual information through three linked views. First, a Venn diagram identifies I(X;Y) as the overlap of H(X) and H(Y), yielding I(X;Y)=H(X)+H(Y)−H(X,Y). Second, it contrasts independence and dependence: independence is shown by p(x,y)=p(x)p(y) and I(X;Y)=0 with a uniform joint grid, while dependence is shown by p(x,y)=p(x)p(y) and I(X;Y)>0 with diagonal concentration. Third, it reframes mutual information as D_{KL}(p(x,y)\,\|\,p(x)p(y)), expands this to ∑x,yp(x,y)logp(x)p(y)p(x,y), states the symmetry I(X;Y)=I(Y;X), and ends with an animation where growing circle overlap represents increasing shared information.
Use the learning inspector for key ideas and moments, or open the reading tabs for the complete notes.
Generated from the video's visuals and explanation; not verbatim speech.
At the beginning, the video poses a real-life question using the scenario "seeing clouds suggests rain": How much does observing one event reduce uncertainty about another? Clouds appear on the left, raindrops on the right, and a question mark connects them, followed directly by the term "Mutual Information." This step introduces mutual information as the reduction in uncertainty.
Next, the video transitions to "Measuring Uncertainty," explaining that before discussing shared information, we need a tool to quantify uncertainty—this is entropy. The sequence is crucial: first comes uncertainty of a single variable, then the comparison of "how much uncertainty remains after observing Y."
To build intuition, the video first presents the fair coin example: P of heads equals zero point five, P of tails equals zero point five, with equally likely outcomes, described by the narrator as maximum uncertainty and assigned H equals one point zero bit. Immediately afterward, it switches to the biased coin: P of heads equals zero point nine, P of tails equals zero point one; because outcomes are more skewed, uncertainty is lower, and entropy drops to zero point four seven bits. Together, these examples show that entropy depends not just on the number of outcomes, but on how evenly the probabilities are distributed.
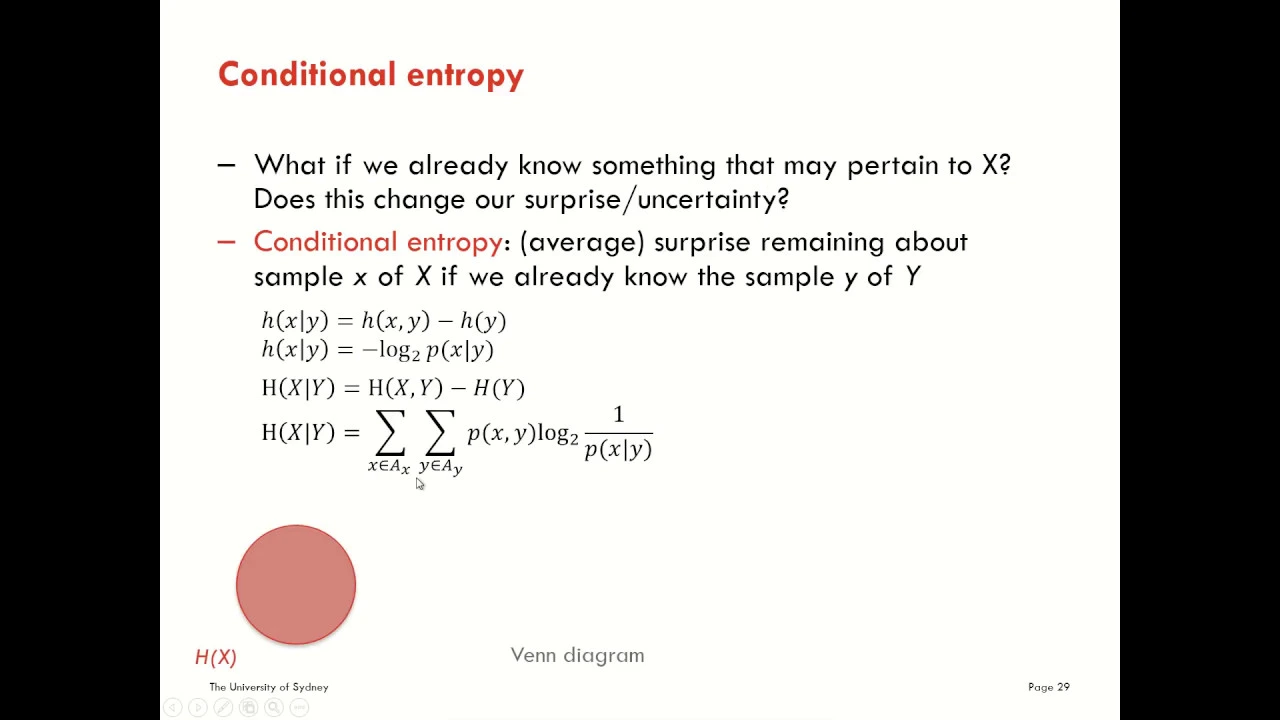
After the examples, the video gives the formal definition: H of X equals negative the sum over x of P of X times log base two of P of X. Here, X is a random variable, P of X is the probability it takes a particular value, and log base two determines the unit as bits. The narrator summarizes entropy as expected surprise—the average degree of unexpectedness.
The next section advances from single-variable entropy to relationships between two variables. A tall rectangle on the left represents H of X, an arrow in the center reads "observe Y," and a shorter rectangle on the right represents H of X given Y. The narrator explains that after observing Y, the remaining uncertainty about X is the conditional entropy; because the right rectangle is shorter, observing Y reduces uncertainty. Immediately, the height difference is defined as mutual information, and the formula I of X semicolon Y equals H of X minus H of X given Y is written. The core idea here is to concretize "information gain" as a measurable difference.
Finally, the video summarizes these quantities using a Venn diagram. The left circle is H of X, the right circle is H of Y, their intersection is I of X semicolon Y, the left crescent is H of X given Y, the right crescent is H of Y given X, and the union of both circles is verbally called joint entropy. This diagram spatializes the earlier algebraic relationships: the shared part is mutual information, the non-shared parts are the conditional entropies in each direction, and the whole represents joint uncertainty. The segment ends here without further elaborating the joint entropy formula or additional examples.
The clip opens on a black slide titled "The Venn Diagram." A blue circle labeled H(X) overlaps a red circle labeled H(Y). The left-only region is labeled H(X|Y), the right-only region H(Y|X), the overlap I(X;Y), and a brace under both circles marks H(X,Y). The narrator says, "So we get this elegant identity," and the formula appears: I(X;Y)=H(X)+H(Y)−H(X,Y). Read visually, the union is joint entropy and the intersection is mutual information, so subtracting the union from the sum of the two circles leaves exactly the overlap.
A new slide titled "Independence vs Dependence" appears. Under "Independent," a square grid indexed by x and y is uniformly orange. The formulas below state p(x,y)=p(x)⋅p(y) and I(X;Y)=0. The narration explains that when X and Y are independent, knowing one tells you nothing about the other; mathematically, the joint law factors into marginals, and the shared-information measure vanishes.
To the right, the "Dependent" panel shows a second grid with darker orange concentration along diagonal bands. Its formulas are p(x,y)=p(x)⋅p(y) and I(X;Y)>0. The contrast is explicit: dependence means the joint distribution has structure beyond the product of marginals, and that structure is measured by strictly positive mutual information.
The slide changes to "A Deeper Symmetry." The central formula is I(X;Y)=DKL(p(x,y)∥p(x)p(y)). The narrator calls this the deepest way to think about mutual information: it measures how far the actual joint distribution is from the joint that would exist under pure independence.
Text appears asking, "How far is the joint distribution from pure independence?" Then the formula is expanded to =∑x,yp(x,y)logp(x)p(y)p(x,y). This line instantiates the discrete KL divergence with P=p(x,y) and Q=p(x)p(y), so mutual information becomes the joint-weighted average log-ratio between the true joint and the independent reference law.
The next displayed equation is I(X;Y)=I(Y;X). The narrator stresses that mutual information is perfectly symmetric: what X reveals about Y is exactly what Y reveals about X. This matches the earlier Venn picture, where the overlap belongs to both circles equally rather than to one direction of inference.
The final animation returns to two circles, initially separated, with the caption "No shared information." As the blue and red circles move together, the caption changes to "Some shared information" and then to "Highly dependent." The growing lens-shaped overlap is the visual proxy for increasing mutual information: more overlap means more that one variable reveals about the other.
The mathematical explanation ends, followed by a brief spoken outro asking viewers to like, subscribe, and comment.
Knowledge cards
01
The intuitive meaning of mutual information
The video uses the "clouds–rain" example to show that mutual information measures how much an observation reduces uncertainty about an unknown event. After seeing clouds, your judgment about whether it will rain becomes more certain; this increase in certainty is mutual information.
02
Entropy measures uncertainty
Before discussing shared information, the video introduces entropy to quantify the inherent uncertainty of a single random variable. The narrator summarizes it as expected surprise: the harder the outcome is to predict, the higher the entropy.
H(X)=−x∑p(x)log2p(x)
03
Fair coin example: maximum uncertainty
When flipping a fair coin, P of heads equals P of tails equals zero point five, so both outcomes are equally likely, yielding maximum uncertainty. The video gives the entropy of this distribution as one point zero bit.
H=1.0bit
04
Biased coin example: entropy decreases
When the coin is biased such that P of heads equals zero point nine and P of tails equals zero point one, outcomes are more concentrated, making prediction easier and uncertainty smaller. The video gives the entropy as approximately zero point four seven bits, illustrating that entropy depends on the probability distribution, not just the number of outcomes.
H=0.47bits
05
Conditional entropy H of X given Y
If another variable Y is observed first, the remaining uncertainty about X is denoted conditional entropy H of X given Y. The video represents it with a shorter rectangle, emphasizing that "after observing Y, the uncertainty about X decreases."
H(X∣Y)
06
The mutual information formula
Mutual information is defined as the difference between the original entropy and the conditional entropy: the uncertainty about X before observing Y, minus the remaining uncertainty after observing Y. The visual depicts this difference directly as the green region.
I(X;Y)=H(X)−H(X∣Y)
07
Information decomposition in the Venn diagram
Finally, the video summarizes the relationships using two overlapping circles: left circle H of X, right circle H of Y, intersection I of X semicolon Y, left crescent H of X given Y, right crescent H of Y given X, and the union of both circles is joint entropy. This diagram clarifies the spatial relationships among entropy, conditional entropy, mutual information, and joint entropy all at once.
08
Entropy Venn diagram identity
The video presents mutual information as the overlap of two entropy circles. The left circle is H(X), the right circle is H(Y), the union is H(X,Y), and the intersection is I(X;Y). From that geometry the clip writes the identity I(X;Y)=H(X)+H(Y)−H(X,Y).
I(X;Y)=H(X)+H(Y)−H(X,Y)
09
Independent variables have zero mutual information
In the independent case, the joint distribution factors as p(x,y)=p(x)p(y). The accompanying grid is uniform, and the clip states I(X;Y)=0. Conceptually, knowing one variable gives no information about the other.
p(x,y)=p(x)⋅p(y),I(X;Y)=0
10
Dependent variables have positive mutual information
The dependent case is shown by a joint grid with diagonal concentration. The formulas state p(x,y)=p(x)p(y) and I(X;Y)>0. The message is that statistical structure beyond the product of marginals produces shared information.
p(x,y)=p(x)⋅p(y),I(X;Y)>0
11
Mutual information as KL divergence from independence
The clip reformulates mutual information as the Kullback-Leibler divergence between the actual joint law and the independent reference law p(x)p(y). This makes mutual information a measure of distance from pure independence.
I(X;Y)=DKL(p(x,y)∥p(x)p(y))
12
Expanded discrete formula for mutual information
Applying the discrete KL-divergence definition gives a sum over all pairs (x,y) of the joint probability times the log-ratio of joint to product-of-marginals. The base of the logarithm is not specified in the clip.
x,y∑p(x,y)logp(x)p(y)p(x,y)
13
Symmetry of mutual information
The video explicitly states that mutual information is symmetric in its arguments. The overlap interpretation and the KL formulation both support the same conclusion: information shared from X to Y equals information shared from Y to X.
I(X;Y)=I(Y;X)
14
Growing overlap means growing dependence
The closing animation moves two circles together while captions change from no shared information to some shared information to highly dependent. The increasing intersection area is used as a visual model for increasing mutual information.
Detailed learning notes
Explore conditions, steps and evidence. Supplementary explanations are labeled separately from content shown in the video.
Symbols · 20
H(X)
Clear evidence
Shown in the video
Evidence
Formula
Observation
Write H of X equals negative the sum over x of P of X times log base two of P of X in the center of the screen.
Audio
Observation
The narrator says, "Formally, entropy is the expected surprise."
Symbol
H(X)
Meaning
The entropy of a random variable X represents the uncertainty about X or the expected surprise.
Domain
X is a discrete random variable; the summation runs over all possible values of x.
p(x)
Clear evidence
Shown in the video
Evidence
Formula
Observation
The term P of X appears in the entropy formula.
Audio
Observation
The narrator reads, "negative the sum of P of X times log of P of X."
Symbol
p(x)
Meaning
The probability that the random variable X takes a particular value x.
Domain
The probability mass function, satisfying P of X is greater than or equal to zero and the sum over all x equals one.
log2
Clear evidence
Shown in the video
Evidence
Formula
Observation
The formula explicitly uses log base two.
Audio
Observation
The narrator says, "times log of P of X," without verbally emphasizing the base.
Uncertainties
The audio says only "log," while the base—two—is specified visually in the formula.
Symbol
log2
Meaning
Logarithm base two yields entropy measured in bits.
Domain
Applied to the probability value P of X.
H(X|Y)
Clear evidence
Shown in the video
Evidence
Formula
Observation
A label H of X given Y appears above the shorter rectangle on the right.
Audio
Observation
The narrator says, "Your remaining uncertainty about X is the conditional entropy, H of X given Y."
Symbol
H(X|Y)
Meaning
The remaining uncertainty about X after observing Y—that is, the conditional entropy.
Domain
X and Y are associated random variables.
I(X;Y)
Clear evidence
Shown in the video
Evidence
Formula
Observation
Write I of X semicolon Y equals H of X minus H of X given Y at the bottom.
Audio
Observation
The narrator says, "The gap between these two, that's mutual information."
Symbol
I(X;Y)
Meaning
The mutual information between X and Y measures how much observing Y reduces the uncertainty about X.
Domain
Two random variables, X and Y.
H(Y)
Clear evidence
Shown in the video
Evidence
Formula
Observation
Label H of Y outside the right circle of the Venn diagram.
Audio
Observation
The narrator says, "one for H of Y on the right."
Symbol
H(Y)
Meaning
The entropy of the random variable Y represents the uncertainty about Y.
Domain
Y is a discrete random variable.
H(Y|X)
Clear evidence
Shown in the video
Evidence
Formula
Observation
Label H of Y given X in the right crescent region of the Venn diagram.
Audio
Observation
The narrator says, "The right crescent is H of Y given X."
Symbol
H(Y|X)
Meaning
The remaining uncertainty about Y after observing X.
Domain
X and Y are associated random variables.
joint entropy
Approximate timing
Shown in the video
Evidence
Audio
Observation
The narrator says, "And the entire region, both circles together, that's the joint entropy."
Diagram
Observation
The visual shows the combined region of two overlapping circles, but the full joint entropy symbol does not appear clearly written.
Uncertainties
The standard notation for joint entropy, H of X comma Y, does not appear clearly written in this segment; only the spoken name is used.
Symbol
joint entropy
Meaning
The uncertainty of the pair of random variables X and Y together corresponds to the union region of the two circles in the Venn diagram.
Domain
X and Y are discrete random variables.
H(X)
Clear evidence
Shown in the video
Evidence
Diagram
Observation
The left circle is labeled H(X) in blue.
Formula
Observation
H(X) appears in the identity I(X;Y)=H(X)+H(Y)−H(X,Y).
Symbol
H(X)
Meaning
Entropy of random variable X.
Domain
Nonnegative real quantity for a discrete random variable X.
H(Y)
Clear evidence
Shown in the video
Evidence
Diagram
Observation
The right circle is labeled H(Y) in red.
Formula
Observation
H(Y) appears in the identity I(X;Y)=H(X)+H(Y)−H(X,Y).
Symbol
H(Y)
Meaning
Entropy of random variable Y.
Domain
Nonnegative real quantity for a discrete random variable Y.
H(X,Y)
Clear evidence
Shown in the video
Evidence
Diagram
Observation
A brace under both circles is labeled H(X,Y).
Audio
Observation
The narrator says 'entropy H of X comma Y' while introducing the joint term.
Formula
Observation
H(X,Y) appears as the subtracted term in I(X;Y)=H(X)+H(Y)−H(X,Y).
Symbol
H(X,Y)
Meaning
Joint entropy of the pair (X,Y).
Domain
Nonnegative real quantity for the joint distribution of X and Y.
H(X|Y)
Clear evidence
Shown in the video
Evidence
Diagram
Observation
The non-overlapping part of the left circle is labeled H(X|Y).
Symbol
H(X|Y)
Meaning
Conditional entropy of X given Y.
Domain
Nonnegative real quantity for the conditional distribution p(x|y).
Knowledge points · 10
The intuitive meaning of mutual information
Clear evidence
Shown in the video
Evidence
Audio
Observation
The narrator introduces the idea by reasoning from clouds to rain: "But how much does seeing clouds actually tell you about rain?" Then says, "That quantity, that reduction in uncertainty, has a name. It's called mutual information."
Diagram
Observation
The left side of the screen shows clouds, the right side shows raindrops, a question mark appears in the middle, and "Mutual Information" appears at the bottom.
Definition
Explanation
The video uses the relationship between "seeing clouds" and "whether it will rain" to illustrate that mutual information measures how much an observation reduces uncertainty about an unknown event. Here, clouds represent the observed variable and rain represents the target variable.
Formula
Conditions
Involves two interrelated random variables or events
One serves as the observation, the other as the inference target
The definition of entropy
Clear evidence
Shown in the video
Evidence
Audio
Observation
The narrator says, "Before we can talk about shared information, we need a way to measure uncertainty itself. And that's entropy." and "Formally, entropy is the expected surprise."
Formula
Observation
The screen displays H of X equals negative the sum over x of P of X times log base two of P of X.
Animation
Observation
Bar charts for a fair coin and a biased coin appear sequentially, each with corresponding entropy values shown.
Definition
Explanation
Entropy measures the uncertainty of a random variable and is interpreted in the video as "expected surprise." The more evenly distributed the outcomes, the higher the entropy; the more certain some outcomes become, the lower the entropy.
Formula
H(X)=−x∑p(x)log2p(x)
Conditions
X is a discrete random variable
P of X is the probability distribution of X
Using logarithm base two gives units of bits
Prerequisites
The intuitive meaning of mutual information
Conditional entropy
Clear evidence
Shown in the video
Evidence
Audio
Observation
The narrator says, "After seeing Y, your remaining uncertainty about X is the conditional entropy, H of X given Y."
Formula
Observation
The screen labels H of X given Y and writes I of X semicolon Y equals H of X minus H of X given Y.
Animation
Observation
A tall rectangle on the left labeled H of X transforms via "observe Y" into a shorter rectangle on the right labeled H of X given Y, with the green region above representing the reduction.
Definition
Explanation
Conditional entropy H of X given Y represents the remaining uncertainty about X after Y has been observed. The video illustrates this intuitively by showing the rectangle height decrease: observing Y reduces uncertainty about X.
Formula
H(X∣Y)
Conditions
X and Y are random variables
Y has been observed or is known
Prerequisites
The definition of entropy
The formula for mutual information
Clear evidence
Shown in the video
Evidence
Audio
Observation
The narrator says, "The gap between these two, that's mutual information."
Formula
Observation
The bottom displays I of X semicolon Y equals H of X minus H of X given Y.
Animation
Observation
The green top region is labeled I of X semicolon Y, corresponding to the height difference between H of X and H of X given Y.
Formula
Explanation
Mutual information equals the original entropy minus the conditional entropy, representing the amount of information about X gained by observing Y. The visual depicts this difference directly as the green region.
Formula
I(X;Y)=H(X)−H(X∣Y)
Conditions
X and Y are random variables
H of X and H of X given Y use the same unit system
Prerequisites
The definition of entropy
Conditional entropy
The Venn diagram representation of mutual information
Clear evidence
Shown in the video
Evidence
Audio
Observation
The narrator says, "Draw two overlapping circles, one for H of X on the left, one for H of Y on the right. The overlap, that's the mutual information... The left crescent is H of X given Y... The right crescent is H of Y given X. And the entire region, both circles together, that's the joint entropy."
Diagram
Observation
Two overlapping circles are labeled H of X and H of Y respectively; their intersection is labeled I of X semicolon Y; the left crescent is labeled H of X given Y; the right crescent is labeled H of Y given X.
Uncertainties
Joint entropy is named only verbally; its standard symbol H of X comma Y does not appear on screen.
Method
Explanation
The video uses two overlapping circles to represent the entropies of two variables: the left circle is H of X, the right circle is H of Y, their intersection is I of X semicolon Y, the left crescent is H of X given Y, the right crescent is H of Y given X, and the union of both circles is the joint entropy. This diagram simultaneously illustrates the spatial relationships among entropy, conditional entropy, mutual information, and joint entropy.
Formula
Conditions
Suitable for illustrating information decomposition between two discrete random variables
Prerequisites
The definition of entropy
Conditional entropy
The formula for mutual information
Venn-diagram identity for mutual information
Clear evidence
Shown in the video
Evidence
Diagram
Observation
A Venn diagram shows H(X) and H(Y) as overlapping circles, with H(X|Y), I(X;Y), and H(Y|X) labeling the three regions and H(X,Y) spanning both circles.
Formula
Observation
The displayed identity is I(X;Y)=H(X)+H(Y)−H(X,Y).
Audio
Observation
The narrator says, 'So we get this elegant identity, I of X semicolon Y equals H of X plus H of Y minus H of X comma Y.'
Formula
Explanation
The clip presents mutual information as the overlap in an entropy Venn diagram. The whole left circle is H(X), the whole right circle is H(Y), the union is H(X,Y), and the intersection is I(X;Y). From that picture the identity I(X;Y)=H(X)+H(Y)−H(X,Y) is read directly.
Formula
I(X;Y)=H(X)+H(Y)−H(X,Y)
Conditions
X and Y are random variables with finite entropies.
The diagram treats H(X,Y) as the union of the two entropy circles and I(X;Y) as their intersection.
Independence characterization by factorization and zero mutual information
Clear evidence
Shown in the video
Evidence
Diagram
Observation
Under the heading 'Independent', a square grid is uniformly shaded orange.
Formula
Observation
The displayed formulas are p(x,y)=p(x)⋅p(y) and I(X;Y)=0.
Audio
Observation
The narrator says that when X and Y are independent, knowing one tells you nothing about the other, the joint distribution is the product of the marginals, and the mutual information is exactly zero.
Definition
Explanation
The video defines the independent case operationally: the joint distribution factors into marginals, and the mutual information vanishes. The uniform orange grid visually represents no concentration pattern in the joint distribution.
Formula
p(x,y)=p(x)⋅p(y),I(X;Y)=0
Conditions
Applies to the case where X and Y are independent.
The displayed notation uses probability mass functions p(x), p(y), and p(x,y).
Prerequisites
Venn-diagram identity for mutual information
Dependence characterized by non-factorization and positive mutual information
Clear evidence
Shown in the video
Evidence
Diagram
Observation
Under the heading 'Dependent', a second square grid shows darker orange concentration along diagonal bands.
Formula
Observation
The displayed formulas are p(x,y)=p(x)⋅p(y) and I(X;Y)>0.
Audio
Observation
The narrator says that when variables are dependent, the joint concentrates along certain patterns, it is no longer the product of marginals, and the mutual information becomes positive.
Definition
Explanation
The dependent case is presented as the contrast to independence: the joint distribution does not equal the product of marginals, and the mutual information is strictly positive. The diagonal shading illustrates structure in the joint law.
Formula
p(x,y)=p(x)⋅p(y),I(X;Y)>0
Conditions
Applies when X and Y are dependent.
The displayed notation uses probability mass functions.
Prerequisites
Independence characterization by factorization and zero mutual information
Mutual information as KL divergence from independence
Clear evidence
Shown in the video
Evidence
Formula
Observation
The screen displays I(X;Y)=D_{KL}(p(x,y) || p(x)p(y)).
Formula
Observation
The expanded line displays =∑x,yp(x,y)logp(x)p(y)p(x,y).
Audio
Observation
The narrator says mutual information is 'the KL divergence between the joint distribution and what the joint would look like if the variables were independent.'
Uncertainties
The logarithm base is not specified.
The clip does not state absolute-continuity conditions for the KL divergence.
Formula
Explanation
The deeper formulation identifies mutual information with the Kullback-Leibler divergence between the actual joint distribution p(x,y) and the independent reference distribution p(x)p(y). The expanded sum makes this explicit as an expectation under the joint of the log-ratio of joint to independent product.
The displayed derivation is for discrete distributions using probability mass functions.
The ratio form requires p(x,y)>0 and p(x)p(y)>0 on the summed support.
Prerequisites
Independence characterization by factorization and zero mutual information
Dependence characterized by non-factorization and positive mutual information
Symmetry of mutual information
Clear evidence
Shown in the video
Evidence
Formula
Observation
The screen displays I(X;Y)=I(Y;X).
Audio
Observation
The narrator says, 'It's perfectly symmetric. I of X semicolon Y equals I of Y semicolon X. What X tells you about Y is exactly what Y tells you about X.'
Formula
Explanation
The clip states that mutual information is symmetric in its arguments. This matches the Venn-diagram picture, where the overlap region is shared by both circles rather than belonging to one side.
Formula
I(X;Y)=I(Y;X)
Conditions
Applies to any pair of random variables X and Y for which mutual information is defined.
Prerequisites
Venn-diagram identity for mutual information
Mutual information as KL divergence from independence
Claims and conditions · 6
The entropy of a fair binary distribution is one bit
Clear evidence
Shown in the video
Evidence
Audio
Observation
The narrator says, "Let's say we flip a fair coin. Heads or tails, each with probability zero point five. You have no idea what's coming. Maximum uncertainty. The entropy here is exactly one bit."
Diagram
Observation
Under Fair Coin, two equally tall blue bars are labeled zero point five each, with H equals one point zero bit written below.
Proposition
Statement
For a single fair coin toss, if P of heads equals P of tails equals zero point five, then its entropy is one point zero bit.
Hypotheses
The random experiment has only two outcomes: heads and tails
The two outcomes have equal probability
Quantifiers
This holds for this specific fair coin example.
The entropy of the biased coin is lower than that of the fair coin
Clear evidence
Shown in the video
Evidence
Audio
Observation
The narrator says, "Now take a biased coin. Zero point nine probability of heads, zero point one for tails... Much less uncertainty. The entropy drops to just zero point four seven bits."
Diagram
Observation
Under Biased Coin, red bars have heights zero point nine and zero point one respectively, with H equals zero point four seven bits written below.
Proposition
Statement
For a biased coin with P of heads equals zero point nine and P of tails equals zero point one, its entropy is approximately zero point four seven bits, less than the fair coin's one point zero bit.
Hypotheses
The random experiment has only two outcomes: heads and tails
The probability distribution is zero point nine and zero point one
Quantifiers
This holds for this specific biased coin example.
Observing Y reduces uncertainty about X
Clear evidence
Shown in the video
Evidence
Audio
Observation
The narrator says, "You start with some uncertainty about X. That's H of X. Now, you observe another variable Y. After seeing Y, your remaining uncertainty about X is the conditional entropy... And notice, this is smaller. Observing Y reduced your uncertainty."
Animation
Observation
A tall rectangle labeled H of X on the left transforms via an arrow labeled "observe Y" into a shorter rectangle labeled H of X given Y on the right.
Uncertainties
The video conveys the idea that observing Y leads to smaller remaining uncertainty through illustrative animation, without providing a general rigorous proof.
Proposition
Statement
Within the video's illustrative framework, observing another variable Y reduces the uncertainty about X from H of X to H of X given Y, and their difference is mutual information.
Hypotheses
There exists an informative connection between X and Y
Y is observed
Quantifiers
The video presents this in general terms, but this segment does not elaborate on strict conditions or proofs.
Information decomposition using a two-circle Venn diagram
Clear evidence
Shown in the video
Evidence
Audio
Observation
The narrator points out the left circle, right circle, intersection, left crescent, right crescent, and overall region one by one.
Diagram
Observation
The positions of H of X, H of Y, I of X semicolon Y, H of X given Y, and H of Y given X in the Venn diagram match the narration.
Uncertainties
The joint entropy symbol does not appear on screen; only its spoken name is used.
Proposition
Statement
The left circle represents H of X, the right circle represents H of Y, their intersection represents I of X semicolon Y, the left crescent represents H of X given Y, the right crescent represents H of Y given X, and the union of both circles represents joint entropy.
Hypotheses
Discusses entropy decomposition between two random variables X and Y
Quantifiers
This holds for this Venn diagram visualization method.
Mutual information vanishes exactly in the independent case
Clear evidence
Shown in the video
Evidence
Formula
Observation
The independent panel shows p(x,y)=p(x)⋅p(y) together with I(X;Y)=0.
Formula
Observation
The dependent panel shows p(x,y)=p(x)⋅p(y) together with I(X;Y)>0.
Audio
Observation
The narrator contrasts independence and dependence by saying mutual information is exactly zero in the independent case and becomes positive in the dependent case.
Uncertainties
The clip presents the equivalence through the two displayed cases rather than stating a formal iff theorem with quantifiers.
Proposition
Statement
For the pair of variables shown, independence corresponds to factorization of the joint and I(X;Y)=0, while dependence corresponds to non-factorization and I(X;Y)>0.
Hypotheses
X and Y are random variables with joint pmf p(x,y) and marginals p(x), p(y).
The comparison is between the independent case and the dependent case.
Quantifiers
For the displayed pair (X,Y): if p(x,y)=p(x)p(y), then I(X;Y)=0; if p(x,y)=p(x)p(y), then I(X;Y)>0.
Symmetry claim for mutual information
Clear evidence
Shown in the video
Evidence
Formula
Observation
The displayed equation is I(X;Y)=I(Y;X).
Audio
Observation
The narrator explicitly says mutual information is perfectly symmetric.
Proposition
Statement
Mutual information satisfies I(X;Y)=I(Y;X).
Hypotheses
X and Y are random variables for which mutual information is defined.
Quantifiers
For all such pairs (X,Y).
Derivations and proofs · 4
Mutual information is obtained from the entropy difference
Clear evidence
Shown in the video
Evidence
Audio
Observation
The narrator first defines H of X, then defines H of X given Y after observing Y, and finally says, "The gap between these two, that's mutual information."
Formula
Observation
The screen writes I of X semicolon Y equals H of X minus H of X given Y.
Animation
Observation
The green region exactly matches the height difference between the left rectangle and the right rectangle.
Intuitive argument
Steps
Expression
H(X)
Explanation
Starts from the initial uncertainty about X
Justification
The video labels the tall rectangle on the left as H of X and the narrator states this is the starting uncertainty about X.
Shown in the video
Expression
observe Y
Explanation
Introduces the observation of another variable Y
Justification
An arrow in the center reads "observe Y"
Shown in the video
Expression
H(X∣Y)
Explanation
After observing Y, the remaining uncertainty about X is denoted the conditional entropy.
Justification
The narrator explicitly says, "your remaining uncertainty about X is the conditional entropy, H of X given Y," and the shorter rectangle on the right is also labeled H of X given Y.
Shown in the video
Expression
I(X;Y)=H(X)−H(X∣Y)
Explanation
Mutual information is defined as the difference between the initial entropy and the conditional entropy.
Justification
The narrator says, "The gap between these two, that's mutual information," and the formula appears simultaneously at the bottom.
Shown in the video
Conclusion
Mutual information can be understood as "the uncertainty about X before observing Y" minus "the remaining uncertainty about X after observing Y."
Information quantities corresponding to each region of the Venn diagram
Clear evidence
Shown in the video
Evidence
Audio
Observation
The narrator describes the left circle, right circle, intersection, left crescent, right crescent, and overall region in order.
Diagram
Observation
Labels in the Venn diagram match the narration for each region.
Uncertainties
The standard joint entropy symbol is not written; only its spoken name is used.
Visual argument
Steps
Expression
H(X)
Explanation
The left circle represents the entropy of X.
Justification
The narrator says, "one for H of X on the left," and H of X is labeled outside the left circle.
Shown in the video
Expression
H(Y)
Explanation
The right circle represents the entropy of Y.
Justification
The narrator says, "one for H of Y on the right," and H of Y is labeled outside the right circle.
Shown in the video
Expression
I(X;Y)
Explanation
The intersection of the two circles represents mutual information.
Justification
The narrator says, "The overlap, that's the mutual information," and I of X semicolon Y is labeled in the intersection.
Shown in the video
Expression
H(X∣Y)
Explanation
The left crescent represents the remaining uncertainty about X given that Y is known.
Justification
The narrator says, "The left crescent is H of X given Y," and H of X given Y is labeled in the left crescent.
Shown in the video
Expression
H(Y∣X)
Explanation
The right crescent represents the remaining uncertainty about Y given that X is known.
Justification
The narrator says, "The right crescent is H of Y given X," and H of Y given X is labeled in the right crescent.
Shown in the video
Expression
joint entropy
Explanation
The union of the two circles represents joint entropy.
Justification
The narrator says, "the entire region, both circles together, that's the joint entropy."
Shown in the video
Conclusion
This Venn diagram visualizes the spatial relationships among H of X, H of Y, I of X semicolon Y, H of X given Y, H of Y given X, and joint entropy.
Deriving the overlap identity from the entropy Venn diagram
Clear evidence
Shown in the video
Evidence
Diagram
Observation
The Venn diagram labels the left circle H(X), the right circle H(Y), the overlap I(X;Y), the exclusive parts H(X|Y) and H(Y|X), and the union H(X,Y).
Formula
Observation
The final displayed identity is I(X;Y)=H(X)+H(Y)−H(X,Y).
Visual argument
Steps
Expression
Explanation
Read the left circle as H(X) and the right circle as H(Y).
Justification
Directly labeled in the diagram.
Shown in the video
Expression
Explanation
Read the union of the two circles as the joint entropy H(X,Y).
Justification
The brace under both circles is labeled H(X,Y).
Shown in the video
Expression
Explanation
Read the intersection as mutual information I(X;Y).
Justification
The overlap region is labeled I(X;Y).
Shown in the video
Expression
I(X;Y)=H(X)+H(Y)−H(X,Y)
Explanation
Use inclusion-exclusion on the two-circle picture: adding the two full circles counts the overlap twice, so subtracting the union leaves exactly the intersection.
Justification
Visual set-region relation encoded by the Venn diagram.
Derived from the video
Conclusion
The diagram yields I(X;Y)=H(X)+H(Y)−H(X,Y).
Expanding the KL-divergence formula for mutual information
Clear evidence
Shown in the video
Evidence
Formula
Observation
The first displayed line is I(X;Y)=D_{KL}(p(x,y) || p(x)p(y)).
Formula
Observation
The second displayed line is =∑x,yp(x,y)logp(x)p(y)p(x,y).
Audio
Observation
The narrator describes the reference distribution as 'what the joint would look like if the variables were independent.'
Uncertainties
The clip does not spell out the general definition of D_{KL} before applying it.
The logarithm base is not stated.
Proof
Steps
Expression
I(X;Y)=DKL(p(x,y)∣∣p(x)p(y))
Explanation
Identify mutual information with the KL divergence from the actual joint distribution to the independent product distribution.
Justification
Displayed formula and narrated interpretation.
Shown in the video
Expression
=x,y∑p(x,y)logp(x)p(y)p(x,y)
Explanation
Apply the discrete KL-divergence formula with P=p(x,y) and Q=p(x)p(y), giving a sum over all (x,y) of the joint probability times the log-ratio.
Justification
Standard definition of D_{KL} for discrete distributions, instantiated to the displayed pair of distributions.
Derived from the video
Conclusion
The displayed mutual information equals the summed log-ratio form.
Worked examples · 2
The entropy of a fair coin
Clear evidence
Shown in the video
Evidence
Audio
Observation
The narrator fully describes the fair coin example and gives its entropy value.
Diagram
Observation
Under Fair Coin, two bars labeled zero point five each, with H equals one point zero bit written below.
Problem
Compares the level of uncertainty in a single fair coin toss and gives its entropy.
Given
The experimental outcome is heads or tails
P(H)=0.5
P(T)=0.5
Goal
Explains the uncertainty and entropy of this distribution.
Steps
Expression
P(H)=0.5,P(T)=0.5
Explanation
Lists the two equally probable outcomes of the fair coin.
Justification
The screen shows two equally tall blue bars under Fair Coin, each labeled zero point five.
Shown in the video
Expression
H=1.0bit
Explanation
Gives the entropy of this fair binary distribution.
Justification
The narrator says, "The entropy here is exactly one bit," and the screen shows H equals one point zero bit below.
Shown in the video
Answer
H=1.0 bit
Verification
Contrasts with the subsequent biased coin example: less uniform distributions correspond to lower entropy.
The entropy of a biased coin
Clear evidence
Shown in the video
Evidence
Audio
Observation
The narrator fully describes the biased coin example and gives its entropy value.
Diagram
Observation
Under Biased Coin, red bars labeled zero point nine and zero point one, with H equals zero point four seven bits written below.
Problem
Compares the level of uncertainty in a single biased coin toss and gives its entropy.
Given
The experimental outcome is heads or tails
P(H)=0.9
P(T)=0.1
Goal
Explains the uncertainty and entropy of this distribution.
Steps
Expression
P(H)=0.9,P(T)=0.1
Explanation
Lists the two unequal-probability outcomes of the biased coin.
Justification
The screen shows two red bars under Biased Coin, labeled zero point nine and zero point one respectively.
Shown in the video
Expression
H=0.47bits
Explanation
Gives the entropy of this biased binary distribution.
Justification
The narrator says, "The entropy drops to just zero point four seven bits," and the screen shows H equals zero point four seven bits below.
Shown in the video
Answer
H=0.47 bits
Verification
Compared to the fair coin's one point zero bit, this illustrates that entropy decreases as probabilities become more concentrated.
Visual events · 8
Weather puzzle opening animation
Clear evidence
Shown in the video
Evidence
Animation
Observation
A black background displays the title "A Weather Puzzle", with a gray cloud cluster on the left, blue raindrops on the right, a yellow question mark in the center, and "Mutual Information" appearing at the bottom.
Audio
Observation
The narrator introduces mutual information using the relationship between clouds and rain.
Objects
Title A Weather Puzzle
Gray cloud cluster
Blue raindrops
Yellow question mark
Text Mutual Information
Changes
The title appears first
Then the cloud and raindrops appear
Then the question mark appears
Finally the Mutual Information text appears
Invariants
The cloud remains on the left and the rain remains on the right
The question mark sits between them indicating an unknown relationship
Interpretation
Uses the observable event "clouds" and the inferable event "rain" to intuitively introduce mutual information as the reduction in uncertainty.
Fair coin versus biased coin comparison animation
Clear evidence
Shown in the video
Evidence
Animation
Observation
Bar charts for Fair Coin and Biased Coin appear sequentially, showing H equals one point zero bit and H equals zero point four seven bits respectively.
Objects
Fair Coin title
Two equally tall blue bars
Biased Coin title
Two unequally tall red bars
Entropy value labels
Changes
First shows the zero point five slash zero point five distribution for the fair coin
Then shows the zero point nine slash zero point one distribution for the biased coin
Each is supplemented with its entropy value below
Invariants
Each group has only two outcomes: heads and tails
Bar height represents probability magnitude
Interpretation
Illustrates intuitively how entropy decreases as probability becomes more concentrated, using bar height uniformity.
Rectangle animation showing entropy reduction after observing Y
Clear evidence
Shown in the video
Evidence
Animation
Observation
A tall rectangle labeled H of X on the left, an arrow in the center reading "observe Y", a shorter rectangle labeled H of X given Y on the right, a green region above labeled I of X semicolon Y, and the formula written at the bottom.
Objects
Tall rectangle H of X
Arrow observe Y
Shorter rectangle H of X given Y
Green top region I of X semicolon Y
Formula I of X semicolon Y equals H of X minus H of X given Y
Changes
The tall rectangle on the left appears first
Then the rightward arrow appears
Then the shorter rectangle on the right appears
Finally the green region and formula highlight the difference
Invariants
The rectangles have similar widths; the height difference represents information gain
The green region always appears above the right rectangle
Interpretation
Rectangle height represents uncertainty magnitude; the green difference region represents the portion of uncertainty reduced by observing Y.
Information theory Venn diagram
Clear evidence
Shown in the video
Evidence
Diagram
Observation
Two overlapping circles are gradually labeled H of X, H of Y, I of X semicolon Y, H of X given Y, and H of Y given X.
Audio
Observation
The narrator explains each part in order of region.
Uncertainties
Joint entropy is named only verbally, not written as a symbol.
Objects
Left circle H of X
Right circle H of Y
Intersection I of X semicolon Y
Left crescent H of X given Y
Right crescent H of Y given X
Overall union joint entropy
Changes
The left circle is drawn first
Then the right circle is drawn to create overlap
Labels for intersection, left crescent, and right crescent are added sequentially
Finally the narrator verbally identifies the whole as joint entropy
Invariants
The left circle always represents the total entropy of X
The right circle always represents the total entropy of Y
The intersection always represents shared information
Interpretation
Uses set area as an analogy for information quantity, spatializing the relationships among entropy, conditional entropy, mutual information, and joint entropy.
Static entropy Venn diagram
Clear evidence
Shown in the video
Evidence
Diagram
Observation
Two overlapping circles appear on black: a blue left circle labeled H(X), a red right circle labeled H(Y), an overlap labeled I(X;Y), exclusive regions labeled H(X|Y) and H(Y|X), and a brace below labeled H(X,Y).
Formula
Observation
The identity I(X;Y)=H(X)+H(Y)−H(X,Y) is written beneath the diagram.
Objects
Blue circle for H(X)
Red circle for H(Y)
Overlap region I(X;Y)
Left exclusive region H(X|Y)
Right exclusive region H(Y|X)
Brace-labeled union H(X,Y)
Changes
The formula I(X;Y)=H(X)+H(Y)−H(X,Y) is introduced under the already visible diagram.
Invariants
The circle colors and region labels remain fixed during this interval.
The overlap continues to represent shared information.
Interpretation
The picture encodes joint entropy as the union, marginal entropies as the full circles, and mutual information as the intersection.
Uniform joint-distribution grid for independence
Clear evidence
Shown in the video
Evidence
Diagram
Observation
A square grid labeled Independent is uniformly filled with orange.
Formula
Observation
Below it appear p(x,y)=p(x)⋅p(y) and I(X;Y)=0.
Objects
Square grid indexed by x horizontally and y vertically
Uniform orange shading
Formulas p(x,y)=p(x)p(y) and I(X;Y)=0
Changes
The independent panel is introduced after the title 'Independence vs Dependence'.
Invariants
No diagonal or localized concentration appears in the grid.
All cells have the same color intensity.
Interpretation
Uniform shading visualizes a joint distribution with no special dependence pattern, matching factorization into marginals and zero mutual information.
Diagonal-pattern joint-distribution grid for dependence
Clear evidence
Shown in the video
Evidence
Diagram
Observation
A second square grid labeled Dependent shows darker orange concentration along diagonal bands.
Formula
Observation
Below it appear p(x,y)=p(x)⋅p(y) and I(X;Y)>0.
Uncertainties
The exact numerical probabilities behind the shading are not shown.
Objects
Second square grid indexed by x and y
Diagonal darker-orange bands
Formulas p(x,y)=p(x)p(y) and I(X;Y)>0
Changes
The dependent panel appears to the right of the independent panel.
Shading changes from uniform to concentrated along diagonal structure.
Invariants
The axes still represent x and y.
The contrast remains between joint structure and the product-of-marginals baseline.
Interpretation
The diagonal concentration visualizes statistical structure in the joint law, corresponding to non-factorization and positive mutual information.
Animated overlap growth as dependence increases
Clear evidence
Shown in the video
Evidence
Animation
Observation
Two separate circles, one blue and one red, move toward each other until they overlap substantially.
Diagram
Observation
Captions change from 'No shared information' to 'Some shared information' to 'Highly dependent' as the overlap grows.
Audio
Observation
The narrator says that when the circles are far apart there is no shared information, and as they come together mutual information grows.
Objects
Blue circle
Red circle
Growing lens-shaped overlap
Changing caption text
Changes
The circles begin separated.
They move closer until a small overlap forms.
They continue moving until the overlap becomes large.
Invariants
The two circles keep their colors.
The overlap region continues to stand for shared information.
Interpretation
The animation maps geometric overlap to increasing mutual information and stronger dependence.
Misconceptions · 5
Entropy depends not only on the number of possible outcomes
Clear evidence
Shown in the video
Evidence
Animation
Observation
Both the fair coin and the biased coin have two outcomes, heads and tails, but their entropies are one point zero bit and zero point four seven bits respectively.
Audio
Observation
The narrator emphasizes that the fair coin has "maximum uncertainty" and the biased coin has "much less uncertainty."
Misconception
One might mistakenly assume uncertainty is the same whenever the number of possible outcomes is identical.
Clarification
The video clarifies, using two coins each with two outcomes but different probabilities, that entropy also depends on how uniformly the probability distribution is spread.
Mutual information is a difference, not the total entropy
Clear evidence
Shown in the video
Evidence
Animation
Observation
The green region occupies only part of the upper area of the right rectangle, not the entire left rectangle.
Formula
Observation
The formula is written as I of X semicolon Y equals H of X minus H of X given Y.
Misconception
One might mistakenly treat H of X itself as mutual information.
Clarification
The video explicitly states that mutual information is the gap between H of X and H of X given Y—the portion of uncertainty reduced by observing Y.
The intersection and union have different meanings in the Venn diagram
Clear evidence
Shown in the video
Evidence
Audio
Observation
The narrator distinguishes "The overlap, that's the mutual information" from "the entire region, both circles together, that's the joint entropy."
Diagram
Observation
The intersection is labeled I of X semicolon Y, while the union of both circles corresponds to joint entropy.
Misconception
One might mistakenly treat the entire two-circle region as mutual information.
Clarification
The video clarifies that the intersection is mutual information, the union is joint entropy, and the left and right crescents are the conditional entropies in each direction.
Treating mutual information as asymmetric
Clear evidence
Shown in the video
Evidence
Formula
Observation
The displayed equation I(X;Y)=I(Y;X) is shown immediately after the KL formulation.
Audio
Observation
The narrator emphasizes that what X tells you about Y is exactly what Y tells you about X.
Misconception
One might think I(X;Y) measures only what X reveals about Y and therefore differs from I(Y;X).
Clarification
The clip explicitly states that mutual information is symmetric: I(X;Y)=I(Y;X).
Confusing dependence with zero mutual information
Clear evidence
Shown in the video
Evidence
Formula
Observation
The independent panel shows I(X;Y)=0 with p(x,y)=p(x)p(y).
Formula
Observation
The dependent panel shows I(X;Y)>0 with p(x,y)=p(x)p(y).
Audio
Observation
The narrator contrasts the two cases directly.
Misconception
One might think dependent variables can still have zero mutual information if some pattern is present.
Clarification
In the clip, dependence is paired with non-factorization of the joint and strictly positive mutual information, while zero mutual information is reserved for the independent case.
Concept relations · 11
The definition of entropy → The intuitive meaning of mutual information
Clear evidence
Shown in the video
Evidence
Audio
Observation
The narrator says, "Before we can talk about shared information, we need a way to measure uncertainty itself. And that's entropy."
Prerequisite
Explanation
The video first establishes the concept of entropy, then uses it to define mutual information.
Conditional entropy → The formula for mutual information
Clear evidence
Shown in the video
Evidence
Formula
Observation
I(X;Y)=H(X)−H(X∣Y)。
Audio
Observation
The narrator first defines conditional entropy, then defines their difference as mutual information.
Proof dependency
Explanation
The mutual information formula directly relies on the definition of conditional entropy.
The definition of entropy → Conditional entropy
Clear evidence
Shown in the video
Evidence
Audio
Observation
The narrator describes H of X given Y as the remaining uncertainty about X after observing Y.
Animation
Observation
The shorter rectangle on the right contrasts with the taller rectangle on the left.
Generalizes
Explanation
Conditional entropy is the remaining uncertainty about X after incorporating the condition "Y is known," built upon the prior concept of entropy.
The formula for mutual information → The Venn diagram representation of mutual information
Clear evidence
Shown in the video
Evidence
Formula
Observation
I of X semicolon Y equals H of X minus H of X given Y appears first.
Diagram
Observation
Then the Venn diagram visually maps the spatial relationships among H of X, H of Y, I of X semicolon Y, H of X given Y, H of Y given X, and joint entropy.
Application
Explanation
The Venn diagram is a visual application of the preceding formulas and conceptual relationships.
The definition of entropy → The entropy of a fair coin
Clear evidence
Shown in the video
Evidence
Animation
Observation
The fair coin and biased coin examples appear before the formal entropy formula.
Audio
Observation
The narrator first uses examples to illustrate maximum and reduced uncertainty, then gives the formal definition.
Application
Explanation
The two coin examples serve to demonstrate concretely how entropy changes with the probability distribution.
The definition of entropy → The entropy of a biased coin
Clear evidence
Shown in the video
Evidence
Animation
Observation
The biased coin example follows immediately after the fair coin example, forming a contrast.
Application
Explanation
The biased coin example similarly illustrates that entropy measures how evenly distributed a probability distribution is.
Venn-diagram identity for mutual information → Mutual information as KL divergence from independence
Clear evidence
Derived from the video
Evidence
Formula
Observation
The clip first gives I(X;Y)=H(X)+H(Y)−H(X,Y), then later gives I(X;Y)=D_{KL}(p(x,y)||p(x)p(y)).
Audio
Observation
The narrator introduces the KL view as 'perhaps the deepest way to think about mutual information' after the earlier identities and independence discussion.
Prerequisite
Explanation
The entropy-overlap identity and the independence/dependence contrast prepare the later reinterpretation of mutual information as distance from the independent joint.
Independence characterization by factorization and zero mutual information → Mutual information as KL divergence from independence
Clear evidence
Shown in the video
Evidence
Formula
Observation
The independent case is written as p(x,y)=p(x)p(y) and I(X;Y)=0.
Formula
Observation
The KL formula compares p(x,y) with p(x)p(y).
Special case
Explanation
Independence is the reference case inside the KL formulation: it is exactly the situation where the joint equals the product distribution used as the comparison distribution.
Dependence characterized by non-factorization and positive mutual information → Independence characterization by factorization and zero mutual information
Clear evidence
Shown in the video
Evidence
Formula
Observation
The dependent panel states p(x,y)=p(x)p(y) and I(X;Y)>0.
Audio
Observation
The narrator explicitly contrasts dependence with independence.
Contrast
Explanation
The dependent case is presented as the opposite of the independent case in both factorization and sign of mutual information.
Mutual information as KL divergence from independence → Symmetry of mutual information
Clear evidence
Derived from the video
Evidence
Formula
Observation
The KL expression is I(X;Y)=D_{KL}(p(x,y)||p(x)p(y)).
Formula
Observation
The next displayed formula is I(X;Y)=I(Y;X).
Audio
Observation
The narrator says 'And notice something elegant. It's perfectly symmetric.'
Uncertainties
The clip does not show the algebraic proof of symmetry step by step.
Proof dependency
Explanation
Because the joint p(x,y) and the reference product p(x)p(y) are both symmetric under swapping X and Y, the KL formulation supports the stated symmetry I(X;Y)=I(Y;X).
Venn-diagram identity for mutual information → Symmetry of mutual information
Clear evidence
Shown in the video
Evidence
Diagram
Observation
The initial Venn diagram labels the overlap itself as I(X;Y).
Formula
Observation
Later the equation I(X;Y)=I(Y;X) is displayed.
Application
Explanation
The overlap interpretation already suggests symmetry, since the shared region belongs equally to both circles; the later formula states this explicitly.
Find an answer · 13
What exactly is mutual information, and how does the video explain it using the clouds and rain example?
Clear evidence
Shown in the video
Evidence
Audio
Observation
The narrator directly asks and answers, "It's called mutual information."
Knowledge points
The intuitive meaning of mutual information
Why must entropy be introduced before mutual information?
Clear evidence
Shown in the video
Evidence
Audio
Observation
The narrator says, "Before we can talk about shared information, we need a way to measure uncertainty itself."
Knowledge points
The definition of entropy
The intuitive meaning of mutual information
Why is the entropy of a fair coin one bit, while the biased coin with zero point nine slash zero point one probabilities is only zero point four seven bits?
Clear evidence
Shown in the video
Evidence
Diagram
Observation
Bar charts and entropy values for Fair Coin and Biased Coin are displayed side by side.
Knowledge points
The definition of entropy
The entropy of a fair coin
The entropy of a biased coin
What is the formal formula for entropy, and what does each symbol represent?
Clear evidence
Shown in the video
Evidence
Formula
Observation
The screen displays H of X equals negative the sum over x of P of X times log base two of P of X.
Knowledge points
The definition of entropy
H(X)
p(x)
log2
What does conditional entropy H of X given Y mean?
Clear evidence
Shown in the video
Evidence
Audio
Observation
The narrator defines H of X given Y as the remaining uncertainty about X.
Knowledge points
Conditional entropy
H(X|Y)
Why is mutual information equal to H of X minus H of X given Y?
Clear evidence
Shown in the video
Evidence
Formula
Observation
The bottom displays I of X semicolon Y equals H of X minus H of X given Y.
Knowledge points
The formula for mutual information
Mutual information is obtained from the entropy difference
Which information quantities correspond to the intersection, left and right crescents, and overall region in the Venn diagram?
Clear evidence
Shown in the video
Evidence
Diagram
Observation
Each region of the Venn diagram is labeled H of X, H of Y, I of X semicolon Y, H of X given Y, and H of Y given X.
Knowledge points
The Venn diagram representation of mutual information
Information quantities corresponding to each region of the Venn diagram
How is mutual information related to joint entropy and marginal entropies?
Clear evidence
Derived from the video
Evidence
Formula
Observation
The displayed identity is I(X;Y)=H(X)+H(Y)−H(X,Y).
Diagram
Observation
The overlap region is labeled I(X;Y).
Knowledge points
Venn-diagram identity for mutual information
Why does mutual information equal zero when variables are independent?
Clear evidence
Derived from the video
Evidence
Formula
Observation
The independent panel shows p(x,y)=p(x)p(y) and I(X;Y)=0.
Formula
Observation
The dependent panel shows p(x,y)=p(x)p(y) and I(X;Y)>0.
Knowledge points
Independence characterization by factorization and zero mutual information
Dependence characterized by non-factorization and positive mutual information
Mutual information vanishes exactly in the independent case
What does the formula I(X;Y)=D_{KL}(p(x,y)||p(x)p(y)) mean conceptually?
Clear evidence
Derived from the video
Evidence
Formula
Observation
The screen displays I(X;Y)=D_{KL}(p(x,y)||p(x)p(y)).
Audio
Observation
The narrator describes it as the divergence between the joint and the independent version of the joint.
Knowledge points
Mutual information as KL divergence from independence
How is the KL-divergence expression for mutual information expanded into a sum?
Clear evidence
Derived from the video
Evidence
Formula
Observation
The expanded line is =∑x,yp(x,y)logp(x)p(y)p(x,y).
Uncertainties
The logarithm base is not specified.
Knowledge points
Mutual information as KL divergence from independence
Expanding the KL-divergence formula for mutual information
Is mutual information symmetric in X and Y?
Clear evidence
Derived from the video
Evidence
Formula
Observation
The displayed equation is I(X;Y)=I(Y;X).
Audio
Observation
The narrator says mutual information is perfectly symmetric.
Knowledge points
Symmetry of mutual information
Symmetry claim for mutual information
Coverage and review notes
Covered · The opening uses clouds and rain to introduce the intuitive meaning of mutual information.
Covered · The title transitions to Measuring Uncertainty, indicating the need to quantify uncertainty first.
Covered · The fair coin example, giving one point zero bit.
Covered · The biased coin example, giving zero point four seven bits.
Covered · The formal entropy formula is written.
Covered · A brief transition to The Information Gain, with no new mathematical content.
Covered · Uses rectangle height differences to explain conditional entropy and mutual information.
Covered · A brief transition to The Venn Diagram, with no new mathematical content.
Covered · Uses the Venn diagram to explain the regional relationships among entropy, conditional entropy, mutual information, and joint entropy.
Covered · Venn diagram and identity I(X;Y)=H(X)+H(Y)−H(X,Y).
Covered · Brief transition from the Venn-diagram slide to the independence/dependence section.
Covered · Independent case with uniform grid, factorization, and I(X;Y)=0.
Covered · Dependent case with diagonal-pattern grid, non-factorization, and I(X;Y)>0.
Covered · Short transition to the 'A Deeper Symmetry' section.
Covered · KL-divergence formulation and its expanded summation.
Reviewed English material v1: card "The intuitive meaning of mutual information" at 0:00 — The video uses the "clouds–rain" example to show that mutual information measures how much an observation reduces uncertainty about an unknown event. After seeing clouds, your judgment about whether it will rain becomes more certain; this increase in certainty is mutual information.
Reviewed English material v1: card "Conditional entropy H of X given Y" at 1:01 — If another variable Y is observed first, the remaining uncertainty about X is denoted conditional entropy H of X given Y. The video represents it with a shorter rectangle, emphasizing that "after observing Y, the uncertainty about X decreases."