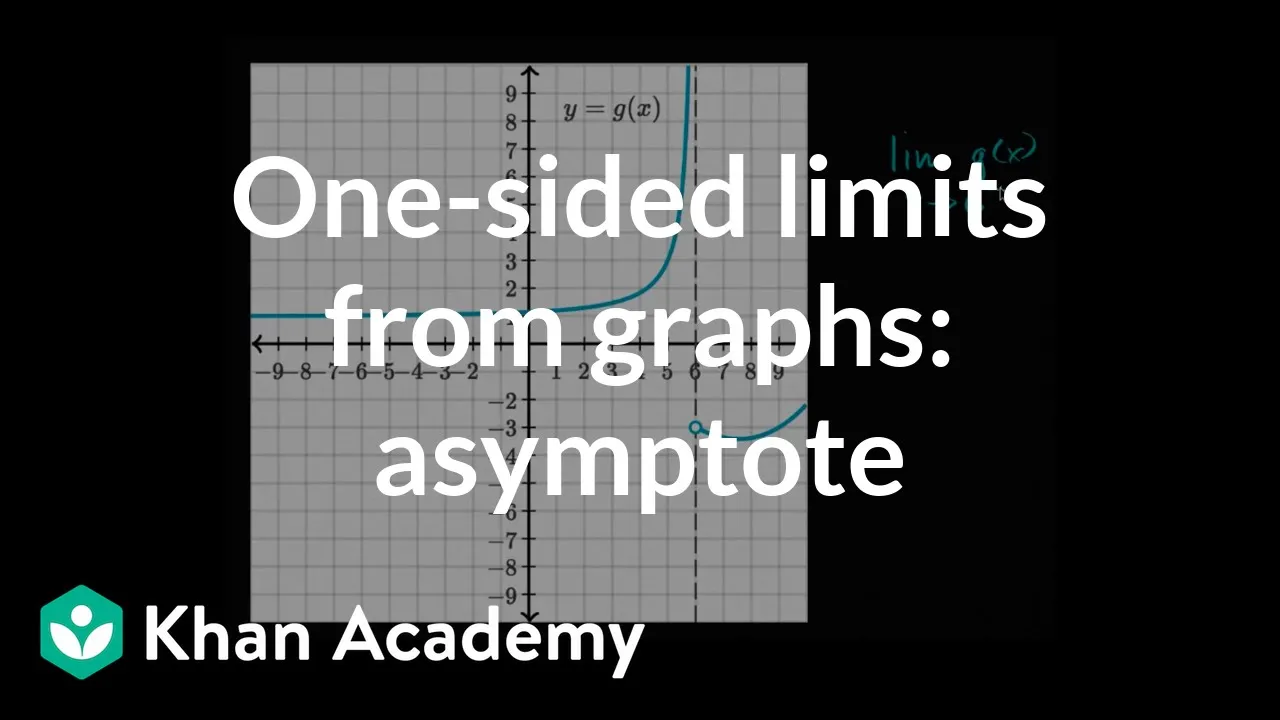
Two-sided limit from graph | Limits | Differential Calculus | Khan Academy
A complete graph exercise comparing left and right limits at the same input and explaining why their disagreement rules out a finite two-sided limit.
Reviewed learning material · Video analysis · English
Can a function have two different approached values at the same input? This graph exercise reads the left-hand limit at 3 as 4 and the right-hand limit as 1, then uses their disagreement to conclude that the two-sided limit does not exist. Moving points and guide lines separate the curve’s nearby behavior from the filled value f(3)=1. The notes clarify that finite sample readings illustrate a limit rather than prove a general formula, and that open or filled markers alone do not determine limiting behavior.
Before you watch
Understanding of function graphs
Basic knowledge of Cartesian coordinates
Reading values from a Cartesian graph
Understanding function notation f(x)
Basic idea of approaching a number on the real line
Generated from the video's visuals and explanation; not verbatim speech.
The video presents a graph of a piecewise function f on a Cartesian coordinate plane. The goal is to determine the limit of f(x) as x approaches 3. To do this systematically, the problem is broken down into evaluating the left-sided limit and the right-sided limit.
The instructor writes the notation for the left-sided limit: limx→3−f(x). The small minus sign superscript on the 3 is explained as indicating that x will approach 3 from values strictly less than 3 (e.g., 1, 2, 2.5, 2.99).
In the illustrated near-point portion of the left branch, start at x=2.5, where y=5, and move towards 3. The curve approaches the open endpoint (3,4). This local reading does not say the entire branch is monotone.
Because the curve approaches a y-value of 4 as x approaches 3 from the left, the left-sided limit is determined to be 4. This is written as limx→3−f(x)=4. The solid dot at (3,1), which represents the actual function value f(3)=1, is ignored for this specific limit calculation, demonstrating that limits describe behavior near a point, not necessarily at the point itself.
Continue with the same graph and consider the right-hand approach to 3. The three statements on the board separate the two-sided, left-hand and right-hand questions.
Sample the right branch at 5, 4 and 3.5. These nearby illustrated points move toward the target height as the input moves toward 3; the exercise uses the displayed branch behavior rather than a finite-point general proof.
Near input 3, the right branch approaches height 1. The guide lines and final written equality record this right-hand limit. The filled point alone is not the justification.
For a finite two-sided limit in this interval setting, both finite one-sided limits must agree. The board gives the left value as 4 and the right value as 1.
The values 4 and 1 differ, so the left and right approaches have no common limiting value. The board therefore marks the two-sided limit as nonexistent.
If the two finite one-sided limits were the same, their common number would give the two-sided limit. Here the mismatch at input 3 completes the answer.
Knowledge cards
01
Left-Sided Limit Notation
A left-sided limit is denoted by a minus superscript on the target value, such as x→c−. It describes the value that the function f(x) approaches as the input x gets arbitrarily close to c from the left side, meaning from values strictly less than c.
x→c−limf(x)
02
Evaluating Limits from a Graph
To find a one-sided limit from a graph, trace the curve from the appropriate side towards the target x-value. Observe the y-value that the curve approaches. The actual y-value of the function at the target x-coordinate (indicated by a solid dot) does not affect the limit; only the behavior of the curve near that x-value matters.
03
Open vs. Closed Circles on Graphs
In this displayed piecewise graph, the open circle at (3,4) marks the left branch endpoint and the solid point at (3,1) gives the function value. The left limit is read from the nearby branch, not from the solid point. Other graphs can have limits at solid points too.
04
Right-hand limit from a graph
Approach the target through inputs on its right. Here the sampled inputs 5, 4 and 3.5 illustrate the right branch approaching height 1, leading to the displayed right-hand limit at 3.
x→3+limf(x)=1
05
Left-hand limit shown on the board
As the input approaches 3 from below, the left branch approaches height 4. The open endpoint marks the approached position in this graph.
x→3−limf(x)=4
06
Limits
For an ordinary finite two-sided limit on a real interval around the target, both finite one-sided limits must exist and equal the same number. Agreement gives the two-sided limit; disagreement rules it out. This exercise has unequal finite values.
x→alimf(x) exists iff x→a−limf(x)=x→a+limf(x)
07
Conclusion for this graph at x=3
At the target input 3, the approached values are 4 on the left and 1 on the right. Their inequality is the reason the two-sided limit does not exist.
x→3limf(x) does not exist
08
Open circle versus solid circle at the break point
The open point (3,4) and filled point (3,1) mark endpoint inclusion in this graph. Determine each limit by following the corresponding nearby branch, not by the marker type alone.
09
Common pitfall: confusing f(3) with the limit
Editorial reminder: the single value f(3) does not determine a limit. Here the filled point is (3,1), but the left branch approaches 4. The unequal one-sided limits defeat a two-sided limit.
Detailed learning notes
Explore conditions, steps and evidence. Supplementary explanations are labeled separately from content shown in the video.
Symbols · 10
f(x)
Clear evidence
Supplementary explanation
Evidence
Formula
Observation
The expression f(x) is written in the prompt at the top right and spoken throughout as the function whose limit is being considered.
Diagram
Observation
The blue curve on the coordinate plane is labeled f and represents the graph of the function.
Symbol
f(x)
Meaning
The value of the function f at input x.
Domain
The shown function is examined near input 3; its full domain is not specified by the viewing window.
x
Clear evidence
Shown in the video
Evidence
Formula
Observation
The variable x appears in the expressions x→3 and x→3−.
Diagram
Observation
The horizontal axis of the coordinate plane is labeled x.
Symbol
x
Meaning
The independent variable or input value of the function f.
Domain
x \in \mathbb{R}
\lim
Clear evidence
Shown in the video
Evidence
Formula
Observation
The notation limx→3−f(x)=4 is written on the screen.
Audio
Observation
The spoken explanation in this interval discusses The limit operator, indicating the value that a function approaches as the input approaches a certain point..
Symbol
\lim
Meaning
The limit operator, indicating the value that a function approaches as the input approaches a certain point.
Domain
N/A
^-
Clear evidence
Shown in the video
Evidence
Formula
Observation
A small minus sign is written as a superscript to the 3 in x→3−.
Audio
Observation
The spoken explanation in this interval discusses Indicates a left-sided or left-hand limit, meaning the input approaches the target value from values strictly less than the target..
Symbol
^-
Meaning
Indicates a left-sided or left-hand limit, meaning the input approaches the target value from values strictly less than the target.
Domain
N/A
f(x)
Clear evidence
Shown in the video
Evidence
Formula
Observation
The function is written as f(x) in the limit expressions on the right side of the screen.
Diagram
Observation
The graph on the left is labeled with an italic f near the curve.
Symbol
f(x)
Meaning
The dependent value of the plotted function at input x.
Domain
Displayed graphically over roughly x=-9 to x=9; the clip focuses on behavior near x=3.
x
Clear evidence
Shown in the video
Evidence
Formula
Observation
The variable x appears in x -> 3, x -> 3^-, and x -> 3^+.
Audio
Observation
The spoken explanation in this interval discusses The independent variable whose values approach 3 from either side..
Symbol
x
Meaning
The independent variable whose values approach 3 from either side.
Domain
Real-valued horizontal coordinate on the graph.
lim_{x -> 3} f(x)
Clear evidence
Supplementary explanation
Evidence
Formula
Observation
The top-right expression reads lim_{x -> 3} f(x).
Audio
Observation
The spoken explanation in this interval discusses The two-sided limit of f(x) as x approaches 3..
Symbol
lim_{x -> 3} f(x)
Meaning
The two-sided limit of f(x) as x approaches 3.
Domain
An ordinary finite two-sided limit is defined when both finite one-sided limits exist and have the same real value.
lim_{x -> 3^-} f(x)
Clear evidence
Shown in the video
Evidence
Formula
Observation
The middle-right expression reads lim_{x -> 3^-} f(x) = 4.
Audio
Observation
The spoken explanation in this interval discusses The left-hand limit of f(x) as x approaches 3 from values less than 3..
Symbol
lim_{x -> 3^-} f(x)
Meaning
The left-hand limit of f(x) as x approaches 3 from values less than 3.
Domain
One-sided limit from the negative direction relative to 3.
lim_{x -> 3^+} f(x)
Clear evidence
Shown in the video
Evidence
Formula
Observation
The bottom-right expression is completed during the clip as lim_{x -> 3^+} f(x) = 1.
Audio
Observation
The spoken explanation in this interval discusses The right-hand limit of f(x) as x approaches 3 from values greater than 3..
Symbol
lim_{x -> 3^+} f(x)
Meaning
The right-hand limit of f(x) as x approaches 3 from values greater than 3.
Domain
One-sided limit from the positive direction relative to 3.
3^- , 3^+
Clear evidence
Shown in the video
Evidence
Formula
Observation
The superscripts '-' and '+' appear on the 3 in the one-sided limit notation.
Audio
Observation
The spoken explanation in this interval discusses Direction markers indicating approach to 3 from below (left) or above (right)..
Symbol
3^- , 3^+
Meaning
Direction markers indicating approach to 3 from below (left) or above (right).
Domain
Used only inside one-sided limit notation.
Knowledge points · 5
Left-sided limit
Clear evidence
Supplementary explanation
Evidence
Formula
Observation
The expression limx→3−f(x)=4 is written on the screen.
Audio
Observation
The spoken explanation in this interval discusses Left-sided limit.
Definition
Explanation
A left-sided limit, denoted by a minus superscript on the target value (e.g., x→3−), describes the value that the function f(x) approaches as the input x gets arbitrarily close to the target value from the left side (i.e., from values strictly less than the target).
Formula
x→c−limf(x)=L
Conditions
The input approaches c through domain values strictly below c.
This displayed graph has a branch defined on an interval immediately to the left; more generally c must be a left accumulation point of the domain.
Evaluating limits graphically
Clear evidence
Shown in the video
Evidence
Audio
Observation
The spoken explanation in this interval discusses Evaluating limits graphically.
Animation
Observation
A red dot moves along the blue curve from left to right towards x=3, and dashed lines project its position to the x and y axes.
Method
Explanation
To evaluate a one-sided limit from a graph, trace the curve starting from an x-value on the appropriate side of the target and move towards the target x-value. Observe the corresponding y-value that the curve approaches. The actual y-value of the function at the target x-coordinate (if it exists) does not affect the limit.
Formula
Conditions
A visual graph of the function is available near the target x-value
Prerequisites
Left-sided limit
Right-hand limit read from a graph
Clear evidence
Shown in the video
Evidence
Audio
Observation
The spoken explanation in this interval discusses Right-hand limit read from a graph.
Formula
Observation
The bottom-right expression is written progressively and ends as lim_{x -> 3^+} f(x) = 1.
Diagram
Observation
The graph shows a solid blue point at (3,1) on the right branch, with dashed guide lines to y=1 and x=3.
Method
Explanation
To estimate lim_{x -> 3^+} f(x), follow the branch of the graph for x>3 as x moves toward 3 from the right and observe the y-value approached by f(x). In this clip, the sampled points x=5, x=4, and x=3.5 lead the speaker to conclude the approached value is 1.
Formula
x→3+limf(x)=1
Conditions
Use the portion of the graph with x>3.
The conclusion is based on visual estimation from the displayed graph.
Prerequisites
lim_{x -> 3^+} f(x)
f(x)
x
Criterion for existence of a two-sided limit
Clear evidence
Supplementary explanation
Evidence
Audio
Observation
The spoken explanation in this interval discusses Criterion for existence of a two-sided limit.
Formula
Observation
The screen displays lim_{x -> 3^-} f(x) = 4 and lim_{x -> 3^+} f(x) = 1 beneath the two-sided expression lim_{x -> 3} f(x).
Audio
Observation
The spoken explanation in this interval discusses Criterion for existence of a two-sided limit.
Definition
Explanation
A two-sided limit exists only when the left-hand and right-hand limits are equal. If those one-sided limits approach different numbers, the two-sided limit does not exist.
Formula
x→3limf(x) exists iff x→3−limf(x)=x→3+limf(x)
Conditions
The function is considered on both sides of the target in a real interval.
Both finite one-sided limits must exist and equal the same real number for a finite two-sided limit.
Prerequisites
lim_{x -> 3} f(x)
lim_{x -> 3^-} f(x)
lim_{x -> 3^+} f(x)
Visual signature of a jump discontinuity at x=3
Clear evidence
Shown in the video
Evidence
Diagram
Observation
At x=3 the graph has an open circle at (3,4) on the left branch and a solid circle at (3,1) on the right branch.
Formula
Observation
The written one-sided limits assign different values: 4 from the left and 1 from the right.
Audio
Observation
The spoken explanation in this interval discusses Visual signature of a jump discontinuity at x=3.
Definition
Explanation
The graph shows a break at x=3: the left branch approaches height 4 but does not include that endpoint, while the right branch starts at height 1 with a filled endpoint. This mismatch in approached heights is why the two-sided limit fails to exist.
Conditions
Interpretation is based on the displayed graph near x=3.
Open circle indicates exclusion of that endpoint; solid circle indicates inclusion.
The left branch approaches an open circle at (3,4), with dashed guides to y=4 and x=3.
Proposition
Statement
\lim_{x \to 3^-} f(x) = 4
Hypotheses
Use the branch of the graph with x<3.
Approach x=3 from the left.
Quantifiers
For x approaching 3 through values less than 3.
Right-hand limit at x=3
Clear evidence
Shown in the video
Evidence
Audio
Observation
The spoken explanation in this interval discusses Right-hand limit at x=3.
Formula
Observation
The bottom-right handwritten statement is completed as lim_{x -> 3^+} f(x) = 1.
Diagram
Observation
The right branch has a solid point at (3,1) with dashed guides to y=1 and x=3.
Proposition
Statement
\lim_{x \to 3^+} f(x) = 1
Hypotheses
Use the branch of the graph with x>3.
Approach x=3 from the right.
Quantifiers
For x approaching 3 through values larger than 3.
Nonexistence of the two-sided limit at x=3
Clear evidence
Shown in the video
Evidence
Audio
Observation
The spoken explanation in this interval discusses Nonexistence of the two-sided limit at x=3.
Formula
Observation
The top-right expression lim_{x -> 3} f(x) is annotated with 'does not exist'.
Formula
Observation
The displayed one-sided limits are unequal: 4 and 1.
Proposition
Statement
\lim_{x \to 3} f(x) \text{ does not exist.}
Hypotheses
\lim_{x \to 3^-} f(x) = 4
\lim_{x \to 3^+} f(x) = 1
4 \neq 1
Quantifiers
Concerns the two-sided approach to x=3.
Derivations and proofs · 3
Derivation of the left-sided limit from the graph
Clear evidence
Shown in the video
Evidence
Audio
Observation
The spoken explanation in this interval discusses Derivation of the left-sided limit from the graph.
Formula
Observation
The final result limx→3−f(x)=4 is written on the screen.
Animation
Observation
The red dot traces the curve and the horizontal dashed line approaches y=4.
Visual argument
Steps
Expression
x→3−
Explanation
Identify the target x-value (3) and the direction of approach (from the left, or values less than 3).
Justification
Definition of a left-sided limit.
Shown in the video
Expression
f(2.5)=5,f(2.75)≈4.5
Explanation
Read the displayed near-point samples as graph estimates, not exact values of an unspecified algebraic function.
Justification
Graphical evaluation of function values.
Supplementary explanation
Expression
x→3−limf(x)=4
Explanation
Observe that as x gets closer and closer to 3 from the left, the y-values of the curve approach 4. The open circle at (3, 4) confirms this target y-value.
Justification
Visual convergence of the graph to the point (3, 4).
Shown in the video
Conclusion
The left-sided limit of f(x) as x approaches 3 is 4.
Estimating the right-hand limit from sample points
Clear evidence
Shown in the video
Evidence
Audio
Observation
The spoken explanation in this interval discusses Estimating the right-hand limit from sample points.
Diagram
Observation
The cursor traces along the right branch toward the solid point at (3,1).
Formula
Observation
The bottom-right limit expression is completed as lim_{x -> 3^+} f(x) = 1.
Uncertainties
The exact intermediate y-values at x=5, x=4, and x=3.5 are not written numerically on screen; only their trend is discussed.
Intuitive argument
Steps
Explanation
Identify the task as finding the limit as x approaches 3 from values larger than 3.
Justification
Stated directly in the audio at the beginning of the clip.
Shown in the video
Expression
x=5
Explanation
Look at the graphed point on the right branch for x=5 and note its height.
Justification
The spoken graph explanation supports this step at the corresponding interval.
Shown in the video
Expression
x=4
Explanation
Move closer to x=3 and inspect the corresponding point on the same branch.
Justification
The spoken graph explanation supports this step at the corresponding interval.
Shown in the video
Expression
x=3.5
Explanation
Take an even closer sample and observe that the function value is a little under 2.
Justification
The spoken graph explanation supports this step at the corresponding interval.
Shown in the video
Expression
x→3+limf(x)=1
Explanation
Conclude that as x approaches 3 from the right, f(x) approaches 1.
Justification
The spoken graph explanation supports this step at the corresponding interval.
Shown in the video
Conclusion
The right-hand limit is estimated visually as 1.
Using one-sided limits to decide the two-sided limit
Clear evidence
Shown in the video
Evidence
Audio
Observation
The spoken explanation in this interval discusses Using one-sided limits to decide the two-sided limit.
Formula
Observation
The screen shows lim_{x -> 3^-} f(x) = 4 and lim_{x -> 3^+} f(x) = 1 under lim_{x -> 3} f(x).
Formula
Observation
The phrase 'does not exist' is written next to the two-sided limit.
Proof
Steps
Explanation
Recall the criterion that a two-sided limit exists only if the left-hand and right-hand limits are equal.
Justification
The spoken graph explanation supports this step at the corresponding interval.
Shown in the video
Expression
x→3−limf(x)=4
Explanation
Record the left-hand limiting value shown on the board.
Justification
Visible in the middle handwritten equation.
Shown in the video
Expression
x→3+limf(x)=1
Explanation
Record the right-hand limiting value just derived.
Justification
Visible in the bottom handwritten equation and supported by the preceding graph reading.
Shown in the video
Expression
4=1
Explanation
Compare the two one-sided limits and note they are different.
Justification
Immediate numerical comparison of the displayed values.
Derived from the video
Expression
x→3limf(x) does not exist
Explanation
Apply the existence criterion to conclude nonexistence of the two-sided limit.
Justification
The speaker states this conclusion directly after contrasting the left and right approaches.
Shown in the video
Conclusion
Because the one-sided limits are unequal, the two-sided limit at x=3 does not exist.
Worked examples · 2
Evaluating a left-sided limit from a piecewise graph
Clear evidence
Shown in the video
Evidence
Diagram
Observation
The entire video focuses on evaluating the limit for the specific piecewise function graphed on the coordinate plane.
Formula
Observation
The prompt limx→3f(x) and the partial solution limx→3−f(x)=4 are written on the screen.
Problem
Given the graph of a function f, determine the value of limx→3−f(x).
Given
The graph of the function f is provided on a Cartesian coordinate system.
The function has a discontinuity at x=3, with an open circle at (3, 4) and a closed circle at (3, 1).
Goal
Find the numerical value of the left-sided limit as x approaches 3.
Steps
Expression
Trace the curve for x<3 towards x=3
Explanation
Start at an x-value less than 3 (e.g., x=2.5) and move along the blue curve towards x=3.
Justification
This visually represents x approaching 3 from the left.
Shown in the video
Expression
Observe the y-values
Explanation
In the sampled near-target portion, the displayed values move from about 5 through about 4.5 towards 4; this does not claim monotonicity across the whole branch.
Justification
Reading the vertical position of the curve relative to the y-axis.
Supplementary explanation
Expression
x→3−limf(x)=4
Explanation
The curve approaches the open circle located at the coordinates (3, 4). Therefore, the y-value it approaches is 4.
Justification
The definition of a limit depends on the behavior of the function near the point, not at the point itself.
Shown in the video
Answer
4
Verification
The visual tracing of the graph clearly shows the curve converging to the y-coordinate of the open circle at x=3, which is 4.
Determining whether lim_{x -> 3} f(x) exists from a graph
Clear evidence
Shown in the video
Evidence
Audio
Observation
The spoken explanation in this interval discusses Determining whether lim_{x -> 3} f(x) exists from a graph.
Diagram
Observation
A coordinate graph with a jump at x=3 is used throughout.
Formula
Observation
Three limit statements are written on the right: the two-sided limit, the left-hand limit, and the right-hand limit.
Problem
Given the displayed graph of f, determine the right-hand limit at x=3 and decide whether the two-sided limit exists.
Given
Graph of f with a break at x=3.
Left branch approaches an open circle at (3,4).
Right branch approaches a solid circle at (3,1).
Already written on screen: \lim_{x \to 3^-} f(x) = 4.
Goal
Find \lim_{x \to 3^+} f(x) and use the one-sided limits to decide the status of \lim_{x \to 3} f(x).
Steps
Expression
Inspect x>3 branch
Explanation
Follow the graph for inputs larger than 3 as they move toward 3.
Justification
This is the definition of a right-hand limit.
Shown in the video
Expression
x=5,x=4,x=3.5
Explanation
Sample several points on the right branch to see the trend of f(x).
Justification
The speaker explicitly names these x-values while tracing the graph.
Shown in the video
Expression
x→3+limf(x)=1
Explanation
Conclude from the trend and the solid endpoint at (3,1) that the right-hand limit is 1.
Justification
Supported by both the spoken estimation and the final handwritten equation.
Shown in the video
Expression
x→3−limf(x)=4=1=x→3+limf(x)
Explanation
Compare the left-hand and right-hand limits.
Justification
Both values are displayed on the board.
Shown in the video
Expression
x→3limf(x) does not exist
Explanation
Since the one-sided limits differ, the two-sided limit fails to exist.
Justification
This is the criterion stated by the speaker and written on screen.
Shown in the video
Answer
\lim_{x \to 3^+} f(x)=1, and therefore \lim_{x \to 3} f(x) does not exist.
Verification
Check that the left-hand and right-hand limiting values are unequal; unequal one-sided limits imply nonexistence of the two-sided limit.
Visual events · 4
Dynamic tracing of the function graph
Clear evidence
Shown in the video
Evidence
Animation
Observation
A red dot appears on the blue curve and moves rightward towards x=3. Dashed red lines connect the dot to the x and y axes, updating dynamically.
Objects
Red dot
Blue curve
Dashed red lines
x-axis
y-axis
Changes
The red dot moves along the blue curve from left to right.
The vertical dashed line moves rightward along the x-axis towards x=3.
The horizontal dashed line moves downward along the y-axis towards y=4.
Invariants
The red dot remains on the blue curve.
The dashed lines always connect the red dot perpendicularly to the axes.
Interpretation
This animation visually demonstrates the concept of a left-sided limit by showing how the function's output (y-value) changes as the input (x-value) approaches the target from the left.
Graph structure around x=3
Clear evidence
Shown in the video
Evidence
Diagram
Observation
The left side of the screen shows a Cartesian graph with x-axis from -9 to 9 and y-axis from -9 to 9.
Diagram
Observation
Near x=3 there is an open circle at (3,4) on the left branch and a solid circle at (3,1) on the right branch.
Diagram
Observation
Dashed guide lines connect these endpoint circles to the axes at x=3 and the corresponding y-values 4 and 1.
Objects
Coordinate axes
Graph of f
Open circle at (3,4)
Solid circle at (3,1)
Dashed guide lines to axes
Changes
The cursor moves along the right branch from larger x-values toward x=3.
The bottom-right limit expression is progressively completed until it reads =1.
The top-right two-sided limit is annotated with 'does not exist'.
Invariants
The left branch continues to indicate approach to height 4.
The right branch continues to indicate approach to height 1.
The mismatch between these two heights remains visible throughout.
Interpretation
The picture encodes different one-sided limiting behaviors at the same x-value, which is the geometric reason the two-sided limit fails.
Stepwise construction of the right-hand limit statement
Clear evidence
Shown in the video
Evidence
Animation
Observation
The bottom-right expression is built step by step from 'lim' to 'lim_{x -> 3^+} f(x)' and finally to '=1'.
Audio
Observation
The spoken explanation in this interval discusses Stepwise construction of the right-hand limit statement.
Objects
Handwritten limit notation
Cursor/pen position on the right panel
Changes
First the limit operator appears.
Then x -> 3^+ is added.
Then f(x) is written.
Finally =1 completes the statement.
Invariants
The target point of approach remains x=3 from the right throughout.
Interpretation
The animation turns a verbal graph-reading procedure into formal one-sided limit notation.
Annotation of nonexistence on the two-sided limit
Clear evidence
Shown in the video
Evidence
Animation
Observation
After comparing the one-sided limits, the words 'does not exist' are written next to lim_{x -> 3} f(x).
Audio
Observation
The spoken explanation in this interval discusses Annotation of nonexistence on the two-sided limit.
Objects
Top-right expression lim_{x -> 3} f(x)
Handwritten phrase 'does not exist'
Changes
The previously bare two-sided limit expression receives a final status annotation.
Invariants
The one-sided limit values 4 and 1 remain unchanged on the board.
Interpretation
The visual annotation records the logical outcome of the comparison between one-sided limits.
Misconceptions · 3
Confusing the function's value with its limit
Clear evidence
Supplementary explanation
Evidence
Diagram
Observation
The graph shows a closed blue circle at (3, 1) and an open blue circle at (3, 4). The limit being calculated is 4.
Uncertainties
This misconception is inferred based on common student errors when evaluating limits from graphs with jump discontinuities; it is not explicitly stated in the video.
Misconception
Students might incorrectly assume that the limit as x approaches 3 is 1, because the solid dot at (3, 1) indicates that f(3) = 1.
Clarification
The limit describes the value the function approaches as x gets infinitely close to 3, not the value of the function exactly at x=3. For a left-sided limit, we only look at the behavior of the curve for x < 3, which approaches the open circle at y=4.
Do not confuse f(3) with the two-sided limit
Clear evidence
Supplementary explanation
Evidence
Diagram
Observation
The graph contains both an open circle at (3,4) and a solid circle at (3,1), so the function value at x=3 is not the same kind of object as the one-sided limiting values.
Audio
Observation
The spoken explanation in this interval discusses Do not confuse f(3) with the two-sided limit.
Uncertainties
This caution is an analyst-added clarification; the video does not explicitly name this misconception.
Misconception
A learner may think the value of the function at x=3 automatically determines lim_{x -> 3} f(x).
Clarification
The two-sided limit depends on what values f(x) approaches from both sides, not just the single plotted value at x=3. Here the graph shows different approached heights from left and right, so the two-sided limit does not exist regardless of the filled point at (3,1).
One-sided limits describe approach, not endpoint labeling alone
Clear evidence
Supplementary explanation
Evidence
Formula
Observation
The board distinguishes \lim_{x -> 3^-} f(x)=4 and \lim_{x -> 3^+} f(x)=1 from any direct statement about f(3).
Diagram
Observation
The open circle at (3,4) and solid circle at (3,1) show endpoint inclusion/exclusion visually.
Uncertainties
This is an analyst-added reminder, not a separately spoken warning in the clip.
Misconception
A learner may treat the filled or open dot itself as the limit without considering the direction of approach.
Clarification
Each one-sided limit is determined by the branch being followed as x approaches 3. The open circle at (3,4) supports the left-hand limit 4, while the solid circle at (3,1) supports the right-hand limit 1.
Concept relations · 4
Evaluating limits graphically → Left-sided limit
Clear evidence
Shown in the video
Evidence
Audio
Observation
The spoken explanation in this interval discusses the displayed limit step.
Animation
Observation
The red dot tracing the curve directly links the geometric path to the algebraic concept of approaching a value.
Application
Explanation
The method of graphical evaluation is applied to determine the specific value of the left-sided limit defined by the notation.
Right-hand limit read from a graph → Criterion for existence of a two-sided limit
Clear evidence
Shown in the video
Evidence
Audio
Observation
The spoken explanation in this interval discusses the displayed limit step.
Formula
Observation
The bottom equation is completed before the top equation is annotated 'does not exist'.
Prerequisite
Explanation
The right-hand limit value is needed before the existence criterion for the two-sided limit can be applied.
Visual signature of a jump discontinuity at x=3 → Criterion for existence of a two-sided limit
Clear evidence
Shown in the video
Evidence
Diagram
Observation
The visual break at x=3 with different approached heights is the central picture used throughout the clip.
Audio
Observation
The spoken explanation in this interval discusses the displayed limit step.
Application
Explanation
The graph provides the concrete case to which the general two-sided-limit existence rule is applied.
Criterion for existence of a two-sided limit → Right-hand limit read from a graph
Clear evidence
Shown in the video
Evidence
Formula
Observation
The board places lim_{x -> 3} f(x) above the two one-sided statements and then marks the top one nonexistent.
Audio
Observation
The spoken explanation in this interval discusses the displayed limit step.
Contrast
Explanation
The two-sided limit is distinguished from each one-sided limit by requiring agreement of both directional approaches.
Find an answer · 6
How do you evaluate a left-sided limit from a graph?
Clear evidence
Shown in the video
Evidence
Audio
Observation
The spoken explanation in this interval discusses the displayed limit step.
Formula
Observation
The notation limx→3−f(x) is written and solved.
Knowledge points
Left-sided limit
Evaluating limits graphically
Derivation of the left-sided limit from the graph
Why does the limit equal 4 when there is a solid dot at y=1?
Clear evidence
Shown in the video
Evidence
Diagram
Observation
The graph clearly displays both an open circle at (3, 4) and a closed circle at (3, 1), and the calculated limit is 4.
Knowledge points
Evaluating limits graphically
Confusing the function's value with its limit
How do you read a right-hand limit from a graph?
Clear evidence
Shown in the video
Evidence
Audio
Observation
The spoken explanation in this interval discusses the displayed limit step.
Formula
Observation
The result is written as \lim_{x \to 3^+} f(x)=1.
Knowledge points
Right-hand limit read from a graph
Right-hand limit at x=3
Estimating the right-hand limit from sample points
Why does the two-sided limit fail to exist when the one-sided limits are different?
Clear evidence
Shown in the video
Evidence
Audio
Observation
The spoken explanation in this interval discusses the displayed limit step.
Formula
Observation
The displayed one-sided limits are 4 and 1, and the top limit is marked 'does not exist'.
Knowledge points
Criterion for existence of a two-sided limit
Nonexistence of the two-sided limit at x=3
Using one-sided limits to decide the two-sided limit
What do the open and solid dots at x=3 tell us about the one-sided limits?
Clear evidence
Shown in the video
Evidence
Diagram
Observation
The graph shows an open circle at (3,4) and a solid circle at (3,1).
Formula
Observation
These correspond respectively to the left-hand and right-hand limiting values written on the board.
Knowledge points
Visual signature of a jump discontinuity at x=3
Graph structure around x=3
Left-hand limit at x=3
Right-hand limit at x=3
Does the value of f(3) determine whether lim_{x -> 3} f(x) exists?
Clear evidence
Supplementary explanation
Evidence
Diagram
Observation
The graph includes a filled point at (3,1) while the left branch approaches (3,4) with an open endpoint.
Audio
Observation
The spoken explanation in this interval discusses the displayed limit step.
Uncertainties
This search target reflects a common learner question supported by the visuals, though the video does not phrase it as a separate FAQ.
Knowledge points
Do not confuse f(3) with the two-sided limit
Criterion for existence of a two-sided limit
Nonexistence of the two-sided limit at x=3
Coverage and review notes
Covered · Introduction to the problem and setting up the notation for the left-sided limit.
Covered · Explanation of the left-sided limit notation and the strategy for evaluating it graphically.
Covered · Step-by-step visual and verbal evaluation of the left-sided limit using the graph, concluding with the final answer.
Covered · The clip introduces the graph, samples points on the right branch, and formally writes the right-hand limit as 1.
Covered · The speaker compares the one-sided limits, states the existence criterion, and annotates the two-sided limit as nonexistent.
Candidate from reviewed en material v1: For an ordinary finite two-sided limit on a real interval around the target, both finite one-sided limits must exist and equal the same number. Agreement gives the two-sided limit; disagreement rules it out. This exercise has unequal finite values.
 math
math