Start with prevalence
The toy population has a disease prevalence of . This prior proportion matters before any test result is observed.
Harvard Online · YouTube · 4:33
A fictional testing scenario shows why a positive result is not the same as a high probability of illness. The lesson combines prevalence, sensitivity and specificity, then counts true and false positives to expose the base-rate fallacy.
Use the learning inspector for key ideas and moments, or open the reading tabs for the complete notes.
Generated from the video's visuals and explanation; not verbatim speech.
The toy population has a disease prevalence of . This prior proportion matters before any test result is observed.
The example assumes sensitivity and specificity. Sensitivity concerns a positive result among people with the disease; specificity concerns a negative result among people without it.
Among 2,000 hypothetical people, 20 have the disease and 1,980 do not. The assumptions produce 19 true positives and 99 false positives, so false positives outnumber true positives even though each stated test rate is high.
The positive group contains people, of whom 19 have the disease. Thus . This differs from . The calculation illustrates probability reasoning in a fictional model.
The toy population has a disease prevalence of . This prior proportion matters before any test result is observed.
The example assumes sensitivity and specificity. Sensitivity concerns a positive result among people with the disease; specificity concerns a negative result among people without it.
Among 2,000 hypothetical people, 20 have the disease and 1,980 do not. The assumptions produce 19 true positives and 99 false positives, so false positives outnumber true positives even though each stated test rate is high.
The positive group contains people, of whom 19 have the disease. Thus . This differs from . The calculation illustrates probability reasoning in a fictional model.
The toy population has a disease prevalence of . This prior proportion matters before any test result is observed. The example assumes sensitivity and specificity. Sensitivity concerns a positive result among people with the disease; specificity concerns a negative result among people without it. Among 2,000 hypothetical people, 20 have the disease and 1,980 do not. The assumptions produce 19 true positives and 99 false positives, so false positives outnumber true positives even though each stated test rate is high. The positive group contains people, of whom 19 have the disease. Thus . This differs from . The calculation illustrates probability reasoning in a fictional model.
The toy population has a disease prevalence of . This prior proportion matters before any test result is observed. The example assumes sensitivity and specificity. Sensitivity concerns a positive result among people with the disease; specificity concerns a negative result among people without it. Among 2,000 hypothetical people, 20 have the disease and 1,980 do not. The assumptions produce 19 true positives and 99 false positives, so false positives outnumber true positives even though each stated test rate is high. The positive group contains people, of whom 19 have the disease. Thus . This differs from . The calculation illustrates probability reasoning in a fictional model.
The model illustrates the difference by showing that (sensitivity) is fixed at , while (positive predictive value) is calculated to be only . This demonstrates that the probability of a positive test given disease is not the same as the probability of disease given a positive test, especially when prevalence is low.
Conditions: Sensitivity is .; Calculated is .; Prevalence is .
False positives are more numerous because the healthy population is much larger than the diseased population. Even though the false positive rate is low (), applying it to a large base (1,980 people) yields a higher absolute count (99) than applying the high sensitivity rate () to a small base (20 people), which yields 19.
Conditions: Prevalence is (20 diseased, 1,980 healthy).; False positive rate is .; Sensitivity is .
A positive test result does not imply a high probability of illness because the base rate (prevalence) of the disease is very low compared to the healthy population. Even with high sensitivity and specificity, the sheer number of healthy individuals produces a large absolute number of false positives.
Conditions: The disease prevalence is .; The test has sensitivity and specificity.; The population is a hypothetical model of 2,000 people.
Prevalence determines the size of the diseased and healthy subgroups in the population. It acts as the prior probability that influences the final posterior probability of disease given a positive test.
Conditions: The model uses a fictional population.; Prevalence is set to .
Sensitivity is the probability of a positive test result given that the person has the disease (), while specificity is the probability of a negative test result given that the person does not have the disease (). In the model, both are assumed to be , but they apply to different subgroups: the sick versus the healthy.
Conditions: The test has sensitivity.; The test has specificity.; The model distinguishes between diseased and non-diseased populations.
The model produces 19 true positives and 99 false positives. True positives are calculated from the 20 diseased individuals using the sensitivity, while false positives are calculated from the 1,980 healthy individuals using the false positive rate (derived from specificity).
Conditions: Population size is 2,000.; Prevalence is (20 diseased, 1,980 healthy).; Sensitivity is .; Specificity is .
To calculate the probability of having the disease given a positive test result, you must count the number of true positives and divide it by the total number of positive results (true positives plus false positives). In the model, this involves identifying the 19 true positives out of the 118 total positive tests, yielding approximately .
Conditions: Prevalence is in a population of 2,000.; Sensitivity is .; Specificity is .
The base-rate fallacy occurs because learners often ignore the low prevalence of the disease (the base rate) and focus only on the high accuracy of the test. This leads to the incorrect assumption that a positive test result is highly likely to be a true positive, when in fact the large number of healthy people generates many more false positives than true positives.
Conditions: Prevalence is low ().; Test accuracy (sensitivity/specificity) is high ().; The observer focuses on test accuracy rather than population composition.
 YouTube6:13
Another explanation of Conditional probability.
Conditional probability YouTube3:47
Another explanation of Conditional probability.
Conditional probability YouTube2:27
Prerequisite in Probability and statistics: Probability → Conditional probability.
Probability · View learning sequence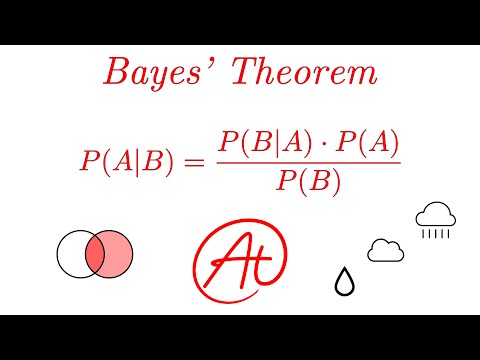 YouTube8:02
Next in Probability and statistics: Conditional probability → Bayes theorem.
Bayes theorem · View learning sequence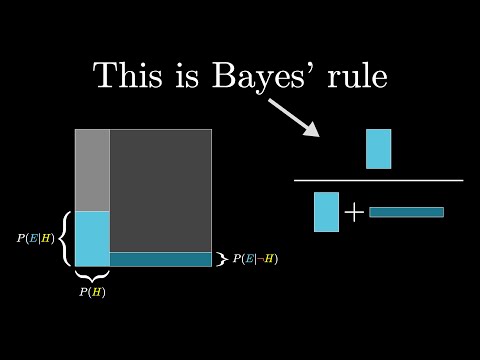 YouTube15:11
Next in Probability and statistics: Conditional probability → Bayes theorem.
Bayes theorem · View learning sequenceYouTube6:13Whiteboard for Conditional probability, compared with the current visual explanation.
Conditional probability