Normal versus positively skewed data
A normal model is symmetric, whereas many positive measurements have a long right tail. A skewed histogram alone does not identify a unique probability distribution.
codebasics · YouTube · 6:44
Introduce the log-normal model by comparing positive skewed measurements with their logarithms.
Use the learning inspector for key ideas and moments, or open the reading tabs for the complete notes.
Generated from the video's visuals and explanation; not verbatim speech.
A normal model is symmetric, whereas many positive measurements have a long right tail. A skewed histogram alone does not identify a unique probability distribution.
A positive variable X is log-normal when ln X follows a normal distribution. Logarithms turn multiplicative ratios into additive differences.
The income example compares the original scale with a logarithmic view. Taking logs may make a suitable positive feature easier to model, but does not guarantee normality or improved prediction; assess the transformed data.
A normal model is symmetric, whereas many positive measurements have a long right tail. A skewed histogram alone does not identify a unique probability distribution.
A positive variable X is log-normal when ln X follows a normal distribution. Logarithms turn multiplicative ratios into additive differences.
The income example compares the original scale with a logarithmic view. Taking logs may make a suitable positive feature easier to model, but does not guarantee normality or improved prediction; assess the transformed data.
A normal model is symmetric, whereas many positive measurements have a long right tail. A skewed histogram alone does not identify a unique probability distribution. A positive variable X is log-normal when ln X follows a normal distribution. Logarithms turn multiplicative ratios into additive differences. The income example compares the original scale with a logarithmic view. Taking logs may make a suitable positive feature easier to model, but does not guarantee normality or improved prediction; assess the transformed data.
 YouTube4:09
Next in Probability and statistics: Normal distribution → Central limit theorem.
Central limit theorem · View learning sequence YouTube10:38
Prerequisite in Probability and statistics: Variance → Normal distribution.
Variance · View learning sequence YouTube10:54
Prerequisite in Probability and statistics: Distributions → Normal distribution.
Distributions · View learning sequence YouTube8:24
Explanation of Normal distribution, complementing the current application.
Normal distribution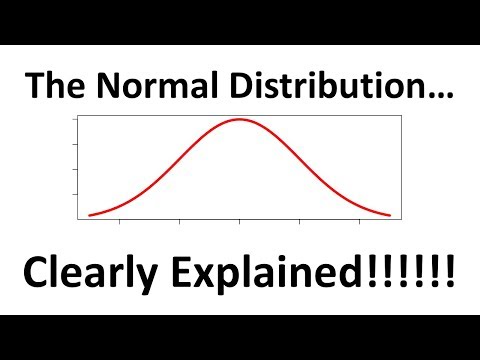 YouTube5:12
Explanation of Normal distribution, complementing the current application.
Normal distribution