Reviewed learning material · Video analysis · EnglishRead the full overview
This 172-second lecture segment introduces outliers in exploratory data analysis, defines them as observations generated by a different mechanism, and presents common detection methods including Z-scores, the IQR rule, Grubbs' test, and visual tools such as box plots, scatter plots, and histograms. It then explains their impact on means, standard deviations, parametric tests, and regression, before listing treatment options: deletion, transformation, capping, imputation, and binning. The clip closes by warning that the chosen method can materially affect analysis results.
Use the learning inspector for key ideas and moments, or open the reading tabs for the complete notes.
Generated from the video's visuals and explanation; not verbatim speech.
The segment opens by placing outliers within exploratory data analysis and announcing both detection and handling as the topic.
It first defines an outlier as an observation so distant from the rest that it suggests a different generating mechanism, then states that finding and treating such points is a crucial preprocessing step.
From there, the lecture turns to identification methods. For Z-scores, the rule given is that points more than three standard deviations from the mean are often treated as outliers.
The IQR method is then stated with explicit fences: values below Q1−1.5⋅IQR or above Q3+1.5⋅IQR are marked as outliers.
Grubbs' test is described more narrowly as a procedure that detects one outlier at a time by looking at the largest deviation from the mean.
After the statistical tests, the explanation shifts to graphical diagnostics. Box plots are said to reveal extreme points beyond the whiskers, scatter plots reveal isolated points away from the main two-dimensional cluster, and histograms reveal isolated bars separated from the bulk of the distribution.
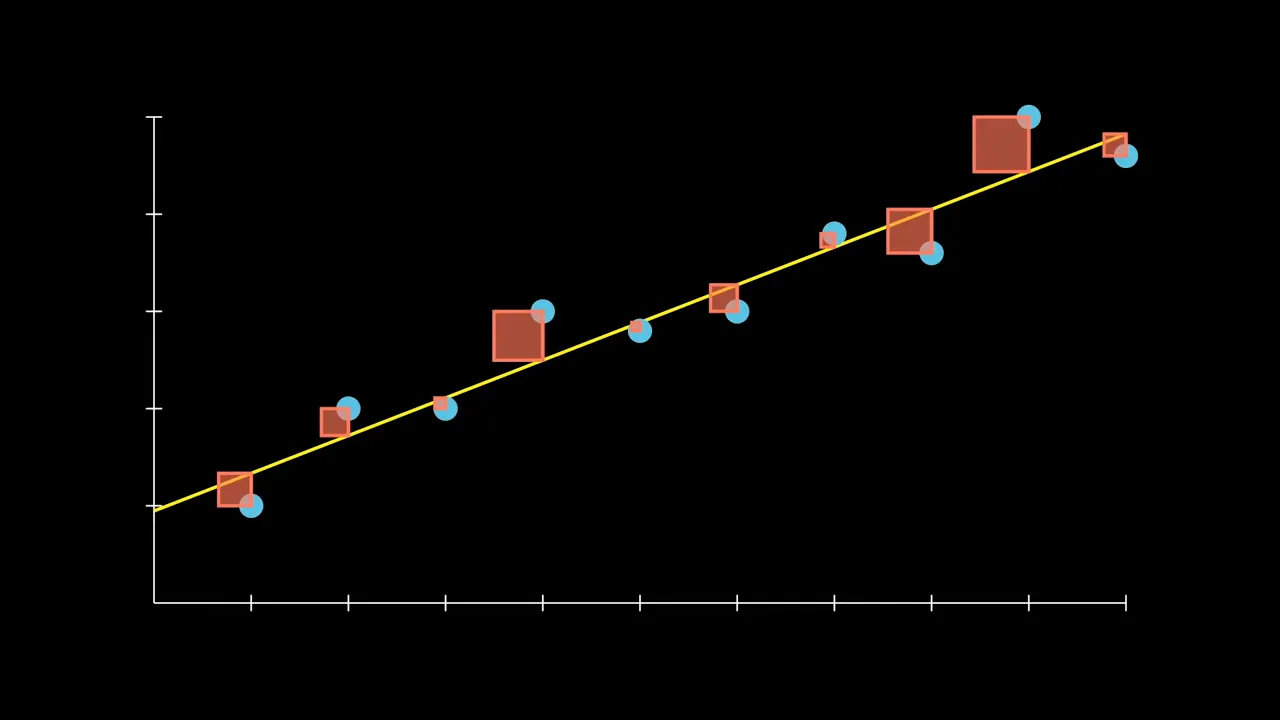
The next section explains why outliers matter analytically. They can distort the mean and standard deviation, skew statistical tests, violate assumptions such as normality in parametric testing, and pull regression slope and intercept estimates enough to make the fitted model inaccurate.
The lecture then lists treatment strategies. Deletion removes suspect points when they are errors or out of scope; transformation, including log transformation, reduces the influence of extreme values; capping restricts values to chosen thresholds; imputation replaces outliers with representative estimates; and binning groups data into categories to lessen outlier effects.
It closes by emphasizing that the choice among these methods is consequential: deletion can discard information, while imputation and transformation can introduce bias, so the method must match the dataset and the analytical objective.
Knowledge cards
01
What an outlier is
An outlier is an observation that deviates so much from other observations that it may have been generated by a different mechanism. The video frames outlier detection and treatment as essential parts of data preprocessing in statistics and data analysis.
02
Z-score rule for outliers
The clip states that with Z-scores, observations more than three standard deviations from the mean are often considered outliers. This is presented as a common practical criterion rather than a proved theorem.
∣x−μ∣>3σ
03
IQR rule for outliers
The interquartile range method flags values outside the fences formed from the first and third quartiles. The video gives the lower and upper cutoffs explicitly.
x<Q1−1.5⋅IQRorx>Q3+1.5⋅IQR
04
Grubbs' test as described in the video
Grubbs' test is described as detecting one outlier at a time based on the largest deviation from the mean. No full test statistic or p-value procedure is shown in this segment.
05
Visual tools for spotting outliers
Box plots show extreme points beyond the whiskers, scatter plots reveal points far from the main cluster in two dimensions, and histograms expose isolated bars separated from the rest of the distribution.
06
Why outliers matter in analysis
Outliers can distort the mean and standard deviation, skew statistical tests, violate assumptions such as normality for parametric tests, and disproportionately affect regression slope and intercept, leading to misleading or inaccurate models.
07
Main treatment methods for outliers
The video lists five treatments: deletion for erroneous or out-of-scope points, transformation such as logs to reduce extreme-value influence, capping to impose thresholds, imputation to replace outliers with representative values, and binning to group data into categories.
08
Caution when choosing a treatment
The closing point is that outlier-handling method choice matters. Deletion can lose information, while imputation and transformation can introduce bias if done incorrectly, so the method should fit the dataset and analytical goals.
Detailed learning notes
Explore conditions, steps and evidence. Supplementary explanations are labeled separately from content shown in the video.
Symbols · 5
IQR
Clear evidence
Shown in the video
Evidence
Audio
Observation
The speaker says “Interquartile Range (IQR) method” and uses IQR in the boundary formulas.
Caption evidence
Observation
The on-screen bullet reads “Common statistical methods include Z-scores, the IQR method, and Grubbs' test, among others.”
Symbol
IQR
Meaning
Interquartile range, the spread between the first quartile Q1 and the third quartile Q3.
Domain
A nonnegative numerical summary of a dataset's middle 50% spread.
Q1
Clear evidence
Shown in the video
Evidence
Audio
Observation
The speaker states that outliers fall below “Q1 - 1.5 * IQR”.
Symbol
Q1
Meaning
First quartile, the lower quartile boundary used in the IQR outlier rule.
Domain
A numeric quantile of the data distribution.
Q3
Clear evidence
Shown in the video
Evidence
Audio
Observation
The speaker states that outliers fall above “Q3+1.5 * IQR”.
Symbol
Q3
Meaning
Third quartile, the upper quartile boundary used in the IQR outlier rule.
Domain
A numeric quantile of the data distribution.
mean
Clear evidence
Shown in the video
Evidence
Audio
Observation
The speaker says observations more than three standard deviations from the mean are often considered outliers.
Audio
Observation
Later the speaker also says Grubbs' test is based on the largest deviation from the mean.
Symbol
mean
Meaning
Arithmetic average of the observations, used as the center in the Z-score and Grubbs' test descriptions.
Domain
A numeric location measure for a dataset.
standard deviation
Clear evidence
Shown in the video
Evidence
Audio
Observation
The speaker says “more than three standard deviations from the mean” when describing Z-scores.
Symbol
standard deviation
Meaning
Measure of dispersion around the mean; here it defines the threshold scale for the Z-score rule.
Domain
A nonnegative numeric spread measure.
Knowledge points · 15
Definition of an outlier
Clear evidence
Shown in the video
Evidence
Audio
Observation
Speaker: “An outlier is an observation that deviates so much from other observations as to arouse suspicion that it was generated by a different mechanism.”
Caption evidence
Observation
Slide text under “Outlier Detection and Treatment:” reads “Outlier detection and treatment refer to identifying and handling data points in a dataset that deviate significantly from the rest of the observations.”
Definition
Explanation
The video defines an outlier as an observation that differs so strongly from the rest of the data that it may have arisen from a different generating mechanism. It then frames outlier detection and treatment as identifying and handling such data points during data preprocessing.
Formula
Conditions
Applies to observations in a dataset.
Used in statistics and data analysis preprocessing.
Z-score outlier identification rule
Clear evidence
Shown in the video
Evidence
Audio
Observation
Speaker: “Statistical tests, Z-scores, where observations more than three standard deviations from the mean are often considered outliers.”
Caption evidence
Observation
On-screen bullet: “Common statistical methods include Z-scores, the IQR method, and Grubbs' test, among others.”
Method
Explanation
The video presents Z-scores as a statistical method for identifying outliers. The stated practical rule is that observations lying more than three standard deviations away from the mean are often treated as outliers.
Formula
∣x−μ∣>3σ
Conditions
Uses the sample or population mean and standard deviation.
The video states this as a common rule rather than a universal theorem.
Prerequisites
Definition of an outlier
IQR outlier identification rule
Clear evidence
Shown in the video
Evidence
Audio
Observation
Speaker: “Interquartile Range (IQR) method identifies outliers by marking data points that fall below Q1 - 1.5 * IQR or above Q3+1.5 * IQR.”
Caption evidence
Observation
On-screen bullet names “the IQR method” among common statistical methods.
Method
Explanation
The interquartile range method flags observations outside the interval determined by the first and third quartiles extended by 1.5 times the IQR. Values below the lower fence or above the upper fence are identified as outliers.
Formula
x<Q1−1.5⋅IQRorx>Q3+1.5⋅IQR
Conditions
Requires quartiles Q1 and Q3 and the interquartile range IQR.
Applied to ordered numerical data.
Prerequisites
Definition of an outlier
Grubbs' test description
Clear evidence
Shown in the video
Evidence
Audio
Observation
Speaker: “Grubbs' test detects one outlier at a time based on the largest deviation from the mean.”
Caption evidence
Observation
On-screen bullet names “Grubbs' test” among common statistical methods.
Method
Explanation
The video describes Grubbs' test as a method that detects one outlier at a time by focusing on the observation with the largest deviation from the mean.
Formula
Conditions
Detects one outlier at a time.
Based on deviation from the mean.
Prerequisites
Definition of an outlier
Box plots for spotting outliers
Clear evidence
Shown in the video
Evidence
Audio
Observation
Speaker: “Box plots illustrate the spread of the data and identify values that fall far from the rest.”
Audio
Observation
Speaker: “Outliers are typically the dots beyond the whiskers.”
Caption evidence
Observation
On-screen bullet: “Visualization tools like box plots, scatter plots, and histograms can also help spot outliers...”
Method
Explanation
The video explains that box plots visualize data spread and make extreme observations visible. In this presentation, outliers are described as the dots beyond the whiskers.
Formula
Conditions
Applies to graphical inspection of distributions.
The whisker-based description is the video's stated convention.
Prerequisites
Definition of an outlier
Scatter plots for spotting outliers
Clear evidence
Shown in the video
Evidence
Audio
Observation
Speaker: “Scatter plots display data points in two dimensions, and outliers may appear far off from the cluster of other data points.”
Caption evidence
Observation
On-screen bullet lists “scatter plots” among visualization tools.
Method
Explanation
The video states that scatter plots show data in two dimensions, and outliers can be recognized when points lie far away from the main cluster of observations.
Formula
Conditions
Requires a two-dimensional display of paired observations.
Prerequisites
Definition of an outlier
Histograms for spotting outliers
Clear evidence
Shown in the video
Evidence
Audio
Observation
Speaker: “Histograms show the distribution of data, and outliers can be spotted as bars that are isolated from others.”
Caption evidence
Observation
On-screen bullet lists “histograms” among visualization tools.
Method
Explanation
The video explains that histograms display the distribution of data, and outliers may appear as isolated bars separated from the bulk of the distribution.
Formula
Conditions
Applies to binned frequency displays of a single variable.
Prerequisites
Definition of an outlier
Impact of outliers on mean and standard deviation
Clear evidence
Shown in the video
Evidence
Audio
Observation
Speaker: “Outliers can significantly distort the mean and standard deviation, leading to misleading conclusions.”
Caption evidence
Observation
Slide text: “Outliers can significantly affect the mean and standard deviation, leading to misleading conclusions.”
Formula
Explanation
The video states that outliers can strongly affect the mean and standard deviation, which can then lead to misleading analytical conclusions.
Formula
Conditions
Concerns descriptive summaries of a dataset.
Prerequisites
Definition of an outlier
Impact of outliers on statistical tests
Clear evidence
Shown in the video
Evidence
Audio
Observation
Speaker: “They can skew the results of statistical tests and violate the assumptions of parametric tests, such as normality.”
Caption evidence
Observation
Slide text: “They can skew the results of statistical tests and violate the assumptions of parametric tests.”
Formula
Explanation
The video states that outliers can skew statistical test results and can violate assumptions of parametric tests, explicitly naming normality as an example.
Formula
Conditions
Applies when using statistical tests whose validity depends on assumptions such as normality.
Prerequisites
Definition of an outlier
Impact of outliers on regression models
Clear evidence
Shown in the video
Evidence
Audio
Observation
Speaker: “In regression analysis, outliers can disproportionately affect the slope and intercept of the line, leading to an inaccurate model.”
Caption evidence
Observation
Slide text: “In regression analysis, outliers can disproportionately influence the slope and intercept, leading to an inaccurate model.”
Formula
Explanation
The video states that in regression analysis outliers can disproportionately affect the fitted line's slope and intercept, producing an inaccurate model.
Formula
Conditions
Applies to regression analysis and fitted linear relationships.
Prerequisites
Definition of an outlier
Deletion as an outlier treatment
Clear evidence
Shown in the video
Evidence
Audio
Observation
Speaker: “Deletion: Removing outliers can be an option if they're due to errors or if they don't fit the scope of the study.”
Caption evidence
Observation
Slide text: “Deletion: Removing outliers when they are errors or do not fit the scope of the study.”
Method
Explanation
The video presents deletion as removing outliers when they are due to errors or fall outside the scope of the study.
Formula
Conditions
Recommended only when outliers are erroneous or out of scope.
Prerequisites
Definition of an outlier
Transformation as an outlier treatment
Clear evidence
Shown in the video
Evidence
Audio
Observation
Speaker: “Transformation, such as log transformation, to reduce the effect of extreme values.”
Caption evidence
Observation
Slide text: “Transformation: Applying a mathematical transformation to reduce the skewness caused by outliers.”
Method
Explanation
The video describes transformation as applying a mathematical change to the data to reduce the influence of extreme values. Log transformation is given as an example.
Formula
Conditions
Used to reduce skewness or the effect of extreme values.
Prerequisites
Definition of an outlier
Claims and conditions · 2
Importance of outlier detection and treatment
Clear evidence
Shown in the video
Evidence
Audio
Observation
Speaker: “Outlier detection and treatment are critical parts of data preprocessing in statistics and data analysis.”
Caption evidence
Observation
Slide heading: “Outlier Detection and Treatment:”
Proposition
Statement
Outlier detection and treatment are critical parts of data preprocessing in statistics and data analysis.
Hypotheses
The context is statistics and data analysis.
The dataset contains observations subject to preprocessing.
Quantifiers
General statement about data preprocessing practice.
Careful choice of outlier-handling method
Clear evidence
Shown in the video
Evidence
Audio
Observation
Speaker: “The method of handling outliers must be chosen carefully, as it can significantly influence the outcome of data analysis.”
Audio
Observation
Speaker: “Each method must be considered in the context of the dataset and the analytical objectives.”
Proposition
Statement
The method chosen for handling outliers must be selected carefully because it can significantly influence the outcome of data analysis.
Hypotheses
There is a dataset with outliers to handle.
Analytical objectives and dataset context are known.
Quantifiers
General cautionary claim about all discussed treatment methods.
Derivations and proofs · 3
Stated Z-score outlier criterion
Clear evidence
Shown in the video
Evidence
Audio
Observation
The speaker introduces Z-scores and immediately states the threshold rule for considering observations outliers.
Uncertainties
The video does not derive the 3-standard-deviation rule from a distributional assumption; it only states it as a common criterion.
Intuitive argument
Steps
Expression
Observations more than three standard deviations from the mean are often considered outliers.
Explanation
The video gives the practical decision rule associated with Z-scores.
Justification
Directly stated by the speaker.
Shown in the video
Conclusion
Under the video's stated rule, an observation is flagged as an outlier when its distance from the mean exceeds three standard deviations.
Stated IQR outlier boundaries
Clear evidence
Shown in the video
Evidence
Audio
Observation
The speaker explicitly states the lower and upper boundary expressions for the IQR method.
Uncertainties
The video does not explain why the multiplier is 1.5; it only gives the rule.
Intuitive argument
Steps
Expression
Lower boundary: Q1−1.5⋅IQR
Explanation
Values below this boundary are marked as outliers.
Justification
Directly stated by the speaker.
Shown in the video
Expression
Upper boundary: Q3+1.5⋅IQR
Explanation
Values above this boundary are marked as outliers.
Justification
Directly stated by the speaker.
Shown in the video
Conclusion
The IQR method classifies observations outside the interval [Q1 - 1.5·IQR, Q3+1.5·IQR] as outliers.
Stated behavior of Grubbs' test
Clear evidence
Shown in the video
Evidence
Audio
Observation
The speaker says Grubbs' test detects one outlier at a time based on the largest deviation from the mean.
Uncertainties
No test statistic formula or significance procedure is shown in this clip.
Intuitive argument
Steps
Expression
Identify the observation with the largest deviation from the mean.
Explanation
The video frames the method around the most extreme deviation.
Justification
Directly stated by the speaker.
Shown in the video
Expression
Detect one outlier at a time.
Explanation
The method is presented as iterative rather than simultaneous.
Justification
Directly stated by the speaker.
Shown in the video
Conclusion
Grubbs' test is described as a one-outlier-at-a-time detection method centered on the largest deviation from the mean.
Visual events · 3
Identifying Outliers slide with progressive highlighting
Clear evidence
Shown in the video
Evidence
Diagram
Observation
A OneNote page titled “Identifying Outliers” shows headings “Outlier Detection and Treatment:” and “Identifying Outliers:” with bullets about statistical methods and visualization tools.
Animation
Observation
Yellow highlighting is applied sequentially to key terms such as “Z-scores,” “IQR method,” “Grubbs' test,” “box plots,” “scatter plots,” and “histograms.”
Objects
OneNote page
Title “Identifying Outliers”
Bullet list of methods
Yellow highlighter marks
Changes
The cursor moves across the page.
Key method names are highlighted one after another as the narration reaches them.
Invariants
The slide remains on the same page throughout this interval.
The underlying bullet text stays visible while highlights are added.
Interpretation
The visual emphasis tracks the spoken enumeration of outlier-detection methods and links each named technique to the corresponding bullet text.
Impact of Outliers slide
Clear evidence
Shown in the video
Evidence
Diagram
Observation
The page changes to “Impact of Outliers” with the heading “Impact of Outliers on Data Analysis:” and four bullets about mean/standard deviation, statistical tests, regression, and robustness.
Animation
Observation
Yellow highlighting appears on phrases including “the mean and standard deviation,” “statistical tests,” “assumptions of parametric tests,” and “In regression analysis.”
Objects
OneNote page
Title “Impact of Outliers”
Four bullet statements
Yellow highlight marks
Changes
The slide switches from identification to impact.
Specific consequence phrases are highlighted as the speaker discusses them.
Invariants
The page layout remains a bulleted list.
No numerical example or plot is shown.
Interpretation
The slide organizes the consequences of outliers into descriptive-statistic distortion, hypothesis-testing violations, regression sensitivity, and the need for robust handling.
Treating Outliers slide
Clear evidence
Shown in the video
Evidence
Diagram
Observation
The page changes to “Treating Outliers” with the heading “Methods for Treating Outliers:” and bullets for Deletion, Transformation, Capping, Imputation, and Binning.
Animation
Observation
Yellow highlighting is added to the method names as each is discussed.
Objects
OneNote page
Title “Treating Outliers”
Five treatment-method bullets
Yellow highlight marks
Changes
The slide switches from impact to treatment methods.
Each method name is highlighted in turn while the narration explains it.
Invariants
The content remains textual; no worked dataset or formula derivation is displayed.
The final spoken caution about method choice occurs over this same slide.
Interpretation
The visual sequence presents a menu of preprocessing strategies and supports the closing claim that method selection should depend on dataset context and analytical goals.
Misconceptions · 2
Deleting outliers is not automatically harmless
Clear evidence
Shown in the video
Evidence
Audio
Observation
Speaker: “Deletion may lead to loss of information, while imputation and transformation can introduce bias if not done correctly.”
Misconception
One might assume that removing outliers simply cleans the data without downside.
Clarification
The video explicitly warns that deletion may cause loss of information, so it should not be treated as a cost-free default.
Imputation and transformation can introduce bias
Clear evidence
Shown in the video
Evidence
Audio
Observation
Speaker: “imputation and transformation can introduce bias if not done correctly.”
Misconception
One might think replacing or transforming outlier values always preserves the original signal.
Clarification
The video states that imputation and transformation can introduce bias if not done correctly, so these methods require careful justification.
Concept relations · 9
Definition of an outlier → Z-score outlier identification rule
Clear evidence
Shown in the video
Evidence
Audio
Observation
After defining outliers, the speaker says “Identifying outliers” and lists statistical methods.
Diagram
Observation
The slide hierarchy places “Identifying Outliers:” under “Outlier Detection and Treatment:”.
Application
Explanation
The definition of an outlier motivates the subsequent detection methods, beginning with Z-scores.
Definition of an outlier → IQR outlier identification rule
Clear evidence
Shown in the video
Evidence
Audio
Observation
The speaker moves from the general definition to specific identification rules, including the IQR method.
Application
Explanation
The IQR rule is one operational way to identify the kind of observation defined as an outlier.
Definition of an outlier → Grubbs' test description
Clear evidence
Shown in the video
Evidence
Audio
Observation
Grubbs' test is introduced immediately after the other statistical identification methods.
Application
Explanation
Grubbs' test is presented as another formal procedure for detecting outliers once the concept has been defined.
Grubbs' test description → Box plots for spotting outliers
Clear evidence
Shown in the video
Evidence
Caption evidence
Observation
The slide groups statistical methods and visualization tools under the same heading “Identifying Outliers:”.
Audio
Observation
The narration shifts from statistical tests to box plots, scatter plots, and histograms.
Contrast
Explanation
The video contrasts numerical statistical detection with graphical detection tools for the same goal of spotting outliers.
Histograms for spotting outliers → Impact of outliers on mean and standard deviation
Clear evidence
Shown in the video
Evidence
Audio
Observation
The speaker says “Now moving to impact of outliers on data analysis.” after finishing identification methods.
Diagram
Observation
The slide changes from “Identifying Outliers” to “Impact of Outliers”.
Application
Explanation
Once outliers can be identified, the lecture turns to why they matter: they affect downstream summaries and models.
Impact of outliers on regression models → Deletion as an outlier treatment
Clear evidence
Shown in the video
Evidence
Audio
Observation
The speaker says “Now moving to methods for treating outliers.” after discussing impacts.
Diagram
Observation
The slide changes from “Impact of Outliers” to “Treating Outliers”.
Application
Explanation
The harms caused by outliers motivate the subsequent treatment methods.
Deletion as an outlier treatment → Transformation as an outlier treatment
Clear evidence
Shown in the video
Evidence
Caption evidence
Observation
All five methods appear as parallel bullets under “Methods for Treating Outliers:”.
Contrast
Explanation
Deletion removes observations, whereas transformation keeps the data but changes its scale to reduce extreme-value effects.
Capping as an outlier treatment → Imputation as an outlier treatment
Clear evidence
Shown in the video
Evidence
Audio
Observation
Capping is described as limiting values to a range, while imputation is described as replacing outliers with representative values.
Contrast
Explanation
Capping constrains extreme values to thresholds, while imputation substitutes estimated representative values.
Careful choice of outlier-handling method → Binning as an outlier treatment
Clear evidence
Shown in the video
Evidence
Audio
Observation
The closing statement evaluates deletion, imputation, and transformation in terms of information loss and bias.
Application
Explanation
The general caution about choosing methods carefully applies to all listed treatments, including binning.
Find an answer · 8
What is an outlier according to the video?
Clear evidence
Shown in the video
Evidence
Audio
Observation
The opening definition is spoken clearly and reinforced by slide text.
Knowledge points
Definition of an outlier
When does the video say a Z-score indicates an outlier?
Clear evidence
Shown in the video
Evidence
Audio
Observation
The speaker states the three-standard-deviation criterion for Z-scores.
Knowledge points
Z-score outlier identification rule
What are the IQR outlier boundaries stated in the clip?
Clear evidence
Shown in the video
Evidence
Audio
Observation
The speaker gives the lower and upper IQR boundary expressions.
Knowledge points
IQR outlier identification rule
How does the video describe Grubbs' test?
Clear evidence
Shown in the video
Evidence
Audio
Observation
The speaker says Grubbs' test detects one outlier at a time from the largest deviation from the mean.
Knowledge points
Grubbs' test description
Which visualization tools are used to identify outliers, and how?
Clear evidence
Shown in the video
Evidence
Audio
Observation
The narration explains box plots, scatter plots, and histograms as ways to spot outliers.
Knowledge points
Box plots for spotting outliers
Scatter plots for spotting outliers
Histograms for spotting outliers
Why are outliers important in data analysis?
Clear evidence
Shown in the video
Evidence
Audio
Observation
The speaker lists effects on mean, standard deviation, statistical tests, and regression.
Knowledge points
Impact of outliers on mean and standard deviation
Impact of outliers on statistical tests
Impact of outliers on regression models
What methods does the video give for treating outliers?
Clear evidence
Shown in the video
Evidence
Audio
Observation
The speaker enumerates deletion, transformation, capping, imputation, and binning.
Knowledge points
Deletion as an outlier treatment
Transformation as an outlier treatment
Capping as an outlier treatment
Imputation as an outlier treatment
Binning as an outlier treatment
What cautions does the video give about selecting an outlier-handling method?
Clear evidence
Shown in the video
Evidence
Audio
Observation
The closing remarks warn that method choice affects analysis outcomes and can introduce bias or information loss.
Knowledge points
Careful choice of outlier-handling method
Deleting outliers is not automatically harmless
Imputation and transformation can introduce bias
Coverage and review notes
Covered · Introductory transition into the topic of outliers and handling outliers.
Covered · Definition of outlier and statement that detection and treatment are critical in preprocessing.
Covered · Statistical identification methods are introduced and explained.
Covered · Visualization-based identification methods are explained.
Covered · Impacts of outliers on analysis are discussed.
Covered · Treatment methods for outliers are listed and defined.
Covered · Closing cautions about choosing treatment methods carefully.
Reviewed English material v1: card/concept_card "What an outlier is" starting at 0:07 — An outlier is an observation that deviates so much from other observations that it may have been generated by a different mechanism. The video frames outlier detection and treatment as essential parts of data preprocessing in statistics and data analysis.
Reviewed English material v1: knowledge_item/formula "Impact of outliers on regression models" from 1:45 to 1:54 — The video states that in regression analysis outliers can disproportionately affect the fitted line's slope and intercept, producing an inaccurate model. Applies to regression analysis and fitted linear relationships.