Definition of regression analysis
Regression analysis is presented as a method for modeling relationships between variables. Its function is to infer or predict one variable using one or more other variables.
numiqo · YouTube · 7:31
This 120-second introductory segment defines regression analysis as a method for modeling relationships between variables and using one or more variables to infer or predict another. It illustrates the idea with a salary example, where highest level of education, weekly working hours, and age are treated as predictors of salary. The clip then names the predicted quantity the dependent variable and the predictive quantities the independent variables, adding common alternative terms such as predictor/input variables and response/outcome/target variable. It closes by stating two main uses of regression analysis: measuring influence and making prediction. This introductory segment explains the two primary purposes of regression analysis: measuring the influence of variables in research contexts and making predictions for application-oriented efficiency. It illustrates these concepts with examples like analyzing children's concentration and predicting hospital stays. The video then transitions to categorizing regression into simple linear, multiple linear, and logistic types, defining simple linear regression as using a single independent variable to predict a dependent variable. This 120-second introductory animation compares simple linear regression, multiple linear regression, and logistic regression using icon-based diagrams. It first distinguishes linear models by the number of independent variables, then unifies them through a metric dependent variable. The clip next introduces logistic regression for categorical outcomes, especially binary logistic regression with two possible values. A summary slide contrasts metric dependent variables in linear regression with categorical/nominal dependent variables in logistic regression, while independent variables are said to be nominal, ordinal, or metric. The final seconds narrow this by stating that categorical predictors in regression must have two levels, illustrated with gender and the beginning of numeric coding. This video segment provides a beginner's guide to different types of regression analysis. It first explains how to handle categorical variables with more than two categories by creating dummy variables. The video then recaps three main types of regression: simple linear regression (one independent variable), multiple linear regression (two or more independent variables), and logistic regression (used for predicting the probability of a categorical outcome, such as a yes/no scenario). Each concept is illustrated with clear, relatable examples involving employee wages and burnout risk.
Use the learning inspector for key ideas and moments, or open the reading tabs for the complete notes.
Generated from the video's visuals and explanation; not verbatim speech.
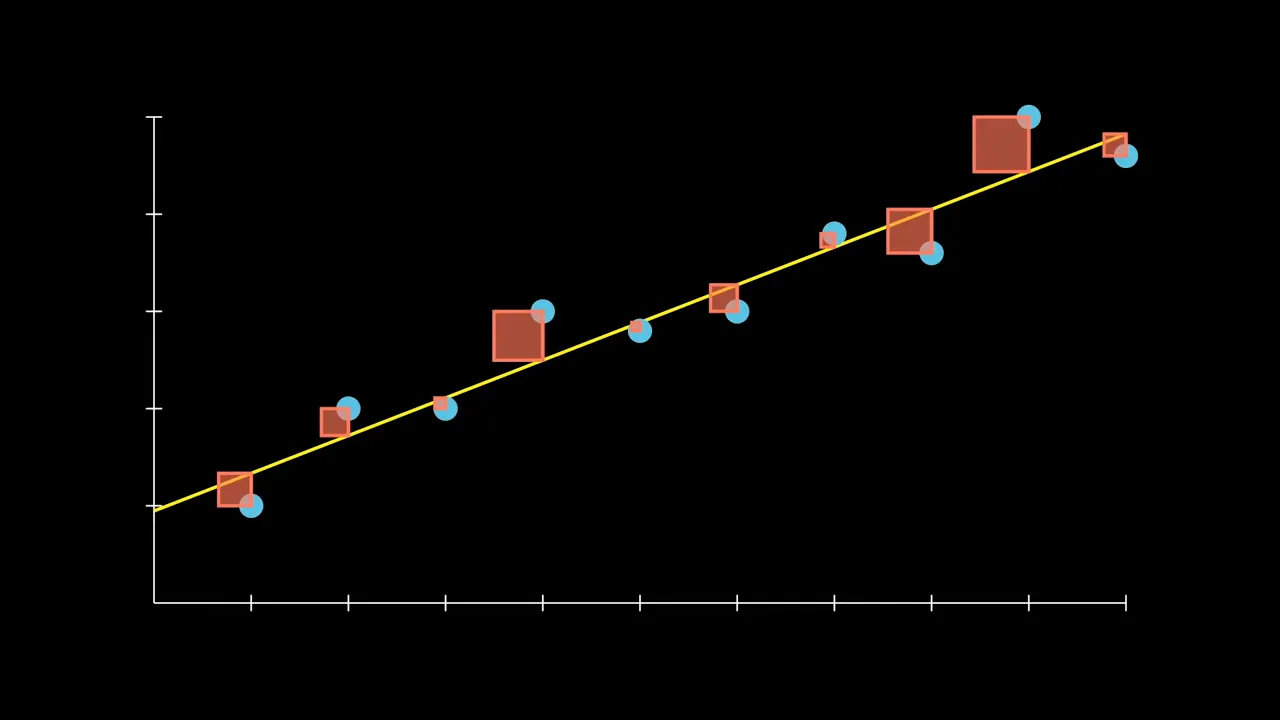
The clip opens with a scatter plot and an upward-sloping yellow line, giving a visual preview of regression as fitting a line through scattered data.
A playlist slide announces the broader series structure: regression analysis first, then simple linear regression, multiple linear regression, and logistic regression.
A brief promotional screen points viewers to the companion book 'Statistics made easy'.
The video then turns to its first substantive question: what regression analysis is.
Regression analysis is defined as a method for modeling relationships between variables. The key idea is that one variable can be inferred or predicted from one or more other variables.
To make the definition concrete, the narrator uses a salary example. Salary is the outcome of interest, and three candidate explanatory variables are introduced: highest level of education, weekly working hours, and age.
The example is framed in two steps. First, one can ask whether these three variables influence salary. Second, if they do, the same variables can be used to predict salary.
The clip then formalizes the terminology. The variable to be inferred or predicted is the dependent variable. The variables used for prediction are the independent variables.
It adds that terminology changes across fields: independent variables may also be called predictor variables or input variables, while the dependent variable may be called the response, output, or target variable.
Finally, the video answers when regression analysis is used by listing two goals: measuring the influence of one or more variables on another variable, and predicting one variable from one or more other variables.
The video begins by establishing the first fundamental purpose of regression analysis: measuring the influence that one or more variables exert on another. This is framed as a research-based objective rather than a predictive one.
To illustrate this, the narrator presents a scenario investigating the factors that influence children's ability to concentrate. The mathematical goal here is to determine whether specific parameters have a positive or negative impact on the dependent variable.
A crucial distinction is made: in this specific research context, the objective is strictly to understand the relationship and measure influence, explicitly noting that there is no interest in actually predicting the children's concentration levels.
A second example from the social sciences is provided, examining whether parents' educational levels and their place of residence influence the future educational attainment of their children. This reinforces the application of regression in economic and social research to quantify variable relationships.
The focus then shifts to the second major area of regression analysis: prediction. Unlike the previous research-based approach, this application is described as highly application-oriented, aiming to use data to forecast outcomes and enhance operational efficiency.
The first predictive example involves hospital management. To optimize bed planning, administrators need to predict how long a prospective patient will stay in the hospital.
Mathematically, this means using independent variables—such as the patient's age, reason for stay, and pre-existing conditions—to forecast the dependent variable, which is the expected duration of the hospital stay.
A second predictive scenario is drawn from e-commerce. An online store operator wants to predict which specific product a visitor is most likely to purchase.
By using regression to forecast this purchasing behavior, the store can proactively suggest products to visitors, directly applying the mathematical prediction to increase sales and business efficiency.
Having established the dual purposes of regression—measuring influence and making predictions—the video transitions to categorizing the specific mathematical models used to achieve these goals.
Three primary types of regression analysis are introduced visually and verbally: simple linear regression, multiple linear regression, and logistic regression.
The segment concludes by defining simple linear regression. The core mathematical constraint of this model is that it utilizes exactly one independent variable to predict a dependent variable, a concept highlighted visually by isolating a single input icon.
The clip opens by defining simple linear regression through a single-predictor diagram. One icon on the left points to a coin stack on the right, matching the narration that only one variable is used, such as education status, weekly working hours, or age.
It then shifts to multiple linear regression. Three predictor icons now converge on the same kind of metric outcome, and the narration names several independent variables together: highest level of education, hours worked per week, and age.
From this comparison, the video extracts the structural difference: simple regression uses one independent variable, multiple regression uses several. Immediately after, it adds the shared feature of both linear forms: the dependent variable is metric.
A dedicated slide makes “metric variable” concrete by cycling through salary, body size, and electricity consumption. The unchanged left-side predictors and changing right-side outcome emphasize that these are examples of quantitative outcomes.
The next transition introduces logistic regression as the contrasting method. Here the outcome is no longer a coin stack but categorical labels such as burnout risk, disease status, or animal type, aligning with the statement that logistic regression is used for a categorical dependent variable.
The clip then narrows to binary logistic regression. Two face icons are boxed together while text explains that the outcome variable is binary and has two possible values. Example pairs appear in sequence: Yes/No, Success/Failure, and Diseased/Not Diseased.
A summary slide consolidates the lesson so far. Under the linear-regression outcomes the label “metric” appears; under the logistic-regression outcome the label “nominal” appears, reflecting the spoken equivalence between categorical and nominal in this context.
Attention then moves from outcomes to predictors. The narration asks about independent variables and states that, in the models shown, they can be nominal, ordinal, or metric, with those three labels printed beneath the predictor groups.
The final seconds revise that broad statement. The screen clears to “Categorical variables with two levels.” and uses gender with male and female as the example. A numeral 0 appears beneath the icons as the narration begins to explain coding, but the segment ends before the full coding scheme is completed.
The video begins by showing how a binary categorical variable can be represented numerically, assigning 0 to one category and 1 to the other.
It then addresses variables with more than two categories, using vehicle type as an example. The solution presented is the creation of dummy variables, which will be explained in detail later in the series.
A quick recap of regression types follows. Simple linear regression is introduced, which examines the effect of exactly one independent variable on a dependent variable, such as how weekly working time affects hourly wage.
Next, multiple linear regression is defined. This method is used when there are at least two independent variables predicting a continuous outcome, like using both weekly working hours and employee age to predict hourly wage.
Finally, logistic regression is explained. Unlike linear regression, it is used to predict the probability of a categorical outcome, such as determining the likelihood of an employee being at risk of burnout (a yes/no category) based on working hours and age.
The segment concludes by summarizing these core concepts and directing the viewer to the next video in the playlist, which will focus specifically on linear regression.
Regression analysis is presented as a method for modeling relationships between variables. Its function is to infer or predict one variable using one or more other variables.
The video illustrates regression with a person's salary as the outcome and three predictors: highest level of education, weekly working hours, and age. This shows how multiple variables can be related to one target variable.
The dependent variable is the variable that we want to infer or predict. In the example, salary plays this role.
Independent variables are the variables used for prediction. In the example, education level, weekly working hours, and age play this role.
The same roles can have different names across fields. Independent variables may be called predictor variables or input variables. The dependent variable may be called response, output, or target variable.
The clip states two main uses: first, measure the influence of one or more variables on another variable; second, predict one variable from one or more other variables.
The first primary use case of regression analysis is to measure the influence that one or more independent variables have on a dependent variable. This approach is highly research-based, focusing on understanding relationships and determining positive or negative impacts rather than making future predictions. It is widely applied in social and economic sciences.
The second primary use case is predicting the value of a dependent variable based on one or more independent variables. This application-oriented approach aims to forecast outcomes to enhance practical efficiency, such as optimizing hospital bed planning or increasing online store sales through targeted product suggestions.
Regression analysis is categorized into several distinct mathematical models based on the number and type of variables involved. The three primary types introduced are simple linear regression, multiple linear regression, and logistic regression.
Simple linear regression is a specific predictive model that utilizes exactly one independent variable to forecast a dependent variable. Visually, it is represented by a single input factor pointing to a continuous numerical outcome.
Simple linear regression is presented as the case with only one independent variable used to predict the dependent variable. The visual example shows a single predictor icon pointing to a coin stack, and the narration lists possible predictors such as education status, weekly working hours, or age.
Multiple linear regression uses several independent variables together to predict or infer the dependent variable. In the clip, three predictor icons converge on the same metric outcome, and the named examples are highest level of education, hours worked per week, and age.
Although simple and multiple linear regression differ in the number of independent variables, the clip states that both have in common that the dependent variable is metric. This is visually reinforced by highlighting the shared coin-stack outcome in both linear panels.
Metric variables are illustrated with concrete quantitative examples: salary, body size, and electricity consumption. These examples define the kind of dependent variable used in the linear-regression portion of the video.
Logistic regression is introduced as the method used when the dependent variable is categorical rather than metric. The examples shown are qualitative outcomes such as risk of burnout, diseased or not, and type of animal.
Binary logistic regression is described as the most common form of logistic regression. Its distinguishing feature in this clip is that the outcome variable is binary, meaning it has exactly two possible values, such as Yes/No, Success/Failure, or Diseased/Not Diseased.
The summary contrast is that linear regression uses a metric dependent variable, while logistic regression uses a categorical dependent variable, also called nominal in this video. The labels metric and nominal are placed directly under the corresponding outcome icons.
For the regression forms discussed, the independent variables are said to be able to have measurement levels of nominal, ordinal, or metric. These three labels appear beneath the predictor groups in the summary slide.
The clip ends by refining the previous statement: in regression, categorical variables can only be used if they have two categories or levels. Gender with male and female is given as the example, and numeric coding is just beginning to be introduced when the segment stops.
When a categorical variable has more than two categories (e.g., vehicle type: car, bus, convertible), dummy variables are created to include this information in a regression model.
A statistical method used to model the relationship between a single independent variable and a continuous dependent variable. For example, predicting hourly wage based solely on weekly working time.
An extension of simple linear regression that models the relationship between two or more independent variables and a continuous dependent variable. For example, predicting hourly wage based on both weekly working time and employee age.
A statistical method used to predict the probability of a binary or categorical outcome (e.g., yes/no, risk/no risk) based on one or more independent variables. For example, predicting the probability of burnout risk based on working hours and age.
Explore conditions, steps and evidence. Supplementary explanations are labeled separately from content shown in the video.
The narration repeatedly contrasts independent variables in simple linear regression, multiple linear regression, and logistic regression.
Icons such as a clock, diploma, and elderly person are placed on the left side of arrows leading to outcome icons.
independent variable
Predictor or explanatory variable used to predict or infer the dependent variable.
Can be metric, ordinal, or nominal; for categorical predictors the video states only two-level categories are used.
The narrator says the dependent variable is metric in linear regression and categorical in logistic regression.
Coins, tape measure, electricity icon, and face icons appear on the right side of arrows as outcomes.
dependent variable
Outcome variable being predicted or inferred by the regression model.
Metric for simple and multiple linear regression; categorical/nominal for logistic regression.
"Both have in common that the dependent variable is metric."
Slide title "Metric variables" with examples Salary, Body size, Electricity.
metric variable
Quantitative variable type used as the dependent variable in linear regression examples.
Examples given: salary, body size, electricity consumption.
"Logistic regression is used when you have a categorical dependent variable."
Slide title "Categorical Variable" with examples Risk of burnout, Diseased or not, Animal.
categorical variable
Qualitative variable type used as the dependent variable in logistic regression.
Examples given: risk of burnout, diseased or not, animal type.
"...categorical variable, also known as nominal variable."
Label "nominal" appears under the logistic-regression outcome faces.
nominal variable
Alternative name used in the video for the categorical dependent variable in logistic regression.
Used synonymously with categorical variable in this clip.
"In this case, the outcome variable is binary, meaning it has two possible values..."
Text "Outcome variable is binary" and "Two possible values" beside smiley/frowny faces.
binary outcome
Categorical outcome with exactly two possible values.
Examples given: Yes/No, Success/Failure, Diseased/Not Diseased.
"Okay, actually in regression you can only use categorical variables with two categories or levels..."
Text "Categorical variables with two levels." followed by male/female icons and the number 0.
The clip ends before the full coding scheme is shown; only the value 0 is visible at the end.
two-level categorical predictor
Independent variable that is categorical but restricted to two categories or levels in regression.
Example given: gender with male and female.
The numeral 0 appears below the male/female icons.
"In this case we can code one..." The spoken sentence is cut off before completion.
Only the first code value is visible; the second code value is not shown within this clip.
0
One of the numeric codes introduced for a two-level categorical predictor.
Appears in the gender example at the very end of the clip.
The text 'Dummy variables' appears on screen next to vehicle icons.
The narrator states, 'we create dummy variables.'
Dummy variables
Variables created to represent categorical data with more than two categories in a regression model.
Categorical data
The text 'One independent variable' and 'At least two independent variables' appear on screen pointing to specific terms.
The narrator mentions 'one independent variable' and 'at least two independent variables'.
Independent variable
A variable that is manipulated or categorized to observe its effect on the dependent variable.
Regression analysis
Terms like 'hourly wage' and 'probability that they are at risk of burnout' are highlighted as outcomes.
The narrator asks if certain factors have an influence on these outcomes.
Dependent variable
The outcome variable being predicted or explained by the independent variables.
Regression analysis
A regression analysis is a method for modeling relationships between variables.
It makes it possible to infer or predict a variable based on one or more other variables.
Three icons on the left point by arrows toward a stack of coins on the right, visually showing multiple inputs related to one outcome.
The video defines regression analysis as a statistical method used to model relationships between variables. Its purpose is to infer or predict one variable from one or more other variables.
There is at least one variable to be inferred or predicted.
There are one or more other variables used as the basis for inference or prediction.
The variable we want to infer or predict is called the dependent variable.
An arrow points to the coin-stack icon while the text identifies it as the dependent variable.
The dependent variable is the variable that the analyst wants to infer or predict. In the salary example, it is the person's salary.
It is the target of inference or prediction in the regression setup.
The variables used for prediction are called independent variables.
The three left-side icons are labeled as independent variables.
Independent variables are the variables used for prediction. In the salary example, they are highest level of education, weekly working hours, and age.
They are used to predict or explain another variable.
Depending on your field, independent variables may also be called predictor variables or input variables.
Under 'Independent variables.' the terms 'Predictor variables' and 'Input variables' appear.
The video states that independent variables may also be called predictor variables or input variables, depending on the field.
Terminology varies by field.
While the dependent variable might be referred to as the response, output or target variable.
Under 'Dependent variable.' the terms 'Response variable', 'Outcome variable', and 'Target variable' appear.
The audio says 'output' while the on-screen list shows 'Outcome variable'; both forms are present in the clip.
The dependent variable may also be referred to as the response variable, outcome variable, or target variable. The spoken wording uses 'response, output or target variable'.
Terminology varies by field.
Regression analysis can be used to achieve two goals.
Numbered list item 1: Measure the influence of one or more variables on another variable.
Numbered list item 2: Prediction of one variable by one or more other variables.
The video presents two purposes for using regression analysis: measuring the influence of one or more variables on another variable, and predicting one variable from one or more other variables.
The first use concerns influence measurement.
The second use concerns prediction.
Let's start by measuring the influence of one or more variables on another.
Measure the influence of one or more variables on another variable.
The first primary use case of regression analysis is to measure the influence that one or more independent variables have on a dependent variable. This approach is highly research-based and focuses on understanding relationships rather than making predictions.
Focuses on understanding relationships between variables
Highly applicable in social and economic sciences
The second area using regression for predictions is more application-oriented.
Prediction of one variable by one or more other variables.
The second primary use case is predicting the value of a dependent variable based on one or more independent variables. This application-oriented approach aims to enhance efficiency in practical scenarios.
Focuses on forecasting outcomes
Highly application-oriented
Now there are different types of regression analysis. There is the simple linear, multiple linear, and logistic regression.
There are different types of Regression Analysis.
Regression analysis encompasses several distinct methods, primarily categorized into simple linear regression, multiple linear regression, and logistic regression, each suited for different data structures and objectives.
In simple linear regression, we use just one independent variable to predict the dependent variable.
Simple linear Regression
Simple linear regression is a specific type of regression analysis that utilizes exactly one independent variable to predict a dependent variable.
Requires exactly one independent variable
"...we use only one variable, either if a person has studied or not, the weekly working hours, or the age of a person."
Left panel titled "Simple linear Regression" shows one input icon pointing to coins.
The clip defines simple linear regression as the case where only one independent variable is used to predict the dependent variable. The visual example uses a single predictor icon pointing to a salary-like coin stack.
There is one independent variable.
The dependent variable is metric.
"Multiple linear regression, on the other hand, uses several independent variables to predict or infer the dependent variable..."
Middle panel titled "Multiple linear Regression" shows three input icons converging on coins.
Multiple linear regression is presented as the extension of simple linear regression in which several independent variables are used together to predict or infer the dependent variable.
There are several independent variables.
The dependent variable is metric.
"Therefore, the difference between a simple and the multiple regression is that in one case only one independent variable is used and in the other case several."
Simple regression uses one independent variable, while multiple regression uses several independent variables.
The models being compared are simple linear regression and multiple linear regression.
For the regression types discussed in this clip.
"Both have in common that the dependent variable is metric."
Both simple and multiple linear regression have a metric dependent variable.
The model is simple linear regression or multiple linear regression.
For both linear-regression forms discussed.
"In contrast, logistic regression is used when you have a categorical dependent variable."
Logistic regression is used when the dependent variable is categorical.
The model is logistic regression.
For the logistic-regression setting described in the clip.
"However, the most common form of logistic regression is the so-called binary logistic regression."
The clip asserts frequency/commonness but provides no evidence or definition of what population of applications this claim refers to.
The most common form of logistic regression is binary logistic regression.
The context is logistic regression methods.
General claim made by the narration without further qualification.
"In this case, the outcome variable is binary, meaning it has two possible values..."
Text "Two possible values".
In binary logistic regression, the outcome variable has two possible values.
The model is binary logistic regression.
For the outcome variable in binary logistic regression.
"In all cases, the level of measurement of the independent variables can be nominal, ordinal, or metric."
Across the regression forms discussed, independent variables can be nominal, ordinal, or metric.
The discussion concerns independent variables in the regression models shown.
In all cases discussed in this clip.
"Okay, actually in regression you can only use categorical variables with two categories or levels..."
This statement conflicts with the immediately preceding broader claim unless interpreted as a refinement specific to categorical predictors; the clip does not elaborate further.
In regression, categorical variables can only be used if they have two categories or levels.
The variable is categorical and is being used as an independent variable in regression.
For categorical independent variables in the regression context of this clip.
Sequential narration compares simple vs multiple regression, then linear vs logistic regression by dependent-variable type.
Three-panel comparison slide with highlighted boxes and later summary labels metric/nominal.
First isolate the distinction between simple and multiple linear regression by counting independent variables.
The narration explicitly says the difference is one versus several independent variables.
Then identify the feature shared by both linear forms: the dependent variable is metric.
The narration states "Both have in common that the dependent variable is metric."
Next introduce logistic regression as the contrasting case with a categorical dependent variable.
The narration says logistic regression is used when the dependent variable is categorical.
Finally summarize the contrast as metric dependent variable for linear regression versus categorical/nominal dependent variable for logistic regression.
The summary slide and narration label the outcomes metric and nominal respectively.
The clip organizes regression types first by number of predictors and then by measurement level of the dependent variable.
The narrator first says independent variables can be nominal, ordinal, or metric, then adds "Okay, actually..." and restricts categorical predictors to two levels.
Labels metric/ordinal/nominal under predictors are replaced by text "Categorical variables with two levels."
The exact formal scope of the refinement is not fully explained before the clip ends.
Start from the broad statement that independent variables may be nominal, ordinal, or metric.
This is directly stated in the narration and shown under the predictor groups.
Introduce a correction signaled by "Okay, actually...".
The audio explicitly marks a revision of the previous statement.
Restrict the categorical case to variables with two categories or levels, using gender as the example.
The narration says regression can only use categorical variables with two categories or levels, such as male and female.
Begin showing numeric coding for the two-level example by displaying 0.
The final frame places 0 under the gender icons while the narration starts "In this case we can code one...".
The clip narrows the general measurement-level statement by adding a special restriction for categorical predictors in regression.
Let's say you want to find out what influences a person's salary.
For example, you could take the highest level of education, the weekly working hours, and the age of a person.
You could now investigate whether these three variables have an influence on the salary of a person.
If they do, you can predict a person's salary by taking the highest level of education, the weekly working hours, and a person's age.
Labels appear beside the three left icons: 'Highest level of education', 'Weekly working hours', and 'Age'; the right icon is framed by the question 'What influences a person's salary?'
Use regression analysis to study what influences a person's salary and whether salary can be predicted from other variables.
Dependent variable: a person's salary.
Independent variables: highest level of education, weekly working hours, and age.
Identify whether the three listed variables influence salary, and if so use them to predict salary.
Choose salary as the variable to be explained or predicted.
The video introduces this as the target question: what influences a person's salary?
Choose highest level of education, weekly working hours, and age as the candidate explanatory variables.
These are explicitly named in the narration and shown as the three left-side inputs.
Investigate whether these three variables have an influence on salary.
This corresponds to the first stated goal of regression analysis: measuring influence.
If such influence exists, use the same three variables to predict a person's salary.
This corresponds to the second stated goal of regression analysis: prediction from other variables.
In this example, salary is the dependent variable, while highest level of education, weekly working hours, and age are the independent variables used to measure influence and make predictions.
The example matches the later definitions: the predicted variable is called dependent, and the variables used for prediction are called independent.
you may be interested in understanding the factors that influence children's ability to concentrate... But in this case you're not interested in predicting children's ability to concentrate.
What influences children's ability to concentrate?
Determine whether certain parameters have a positive or negative impact on children's ability to concentrate.
Independent variables: certain parameters
Dependent variable: children's ability to concentrate
Measure the influence of parameters on concentration without predicting the concentration itself.
Identify the parameters and the concentration ability as variables.
Setting up the variables for regression analysis.
Analyze the positive or negative impact of the parameters on the dependent variable.
Measuring influence is the goal of this research-based application.
The regression model reveals the direction and magnitude of the influence of the parameters on children's concentration.
The example explicitly states that prediction is not the goal, confirming it as an influence-measuring scenario.
Or you could investigate whether the educational level of the parents and the place of residence have an influence on the future educational level of children.
Do the educational level of parents and place of residence have an influence on the future educational level of children?
Investigate whether the educational level of parents and place of residence have an influence on the future educational level of children.
Independent variables: educational level of parents, place of residence
Dependent variable: future educational level of children
Measure the influence of parental education and residence on a child's future education.
Define the independent and dependent variables based on the research question.
Structuring the regression analysis for influence measurement.
Evaluate the statistical influence of the two independent variables on the dependent variable.
This aligns with the research-based application of regression in social sciences.
The analysis determines the extent to which parents' education and residence influence the children's future educational outcomes.
The video categorizes this under research-based applications in social and economic sciences.
To get the most out of hospital occupancy, you might be interested in how long a patient will stay in the hospital. So based on the characteristics of the prospective patient such as age, reason for stay, and pre-existing conditions, you want to know how long that person is likely to stay in the hospital.
How long does a patient stay in the hospital? Age, Reason for stay, Pre-existing conditions -> How long a patient will stay in hospital.
Predict how long a prospective patient will stay in the hospital based on their characteristics to optimize bed planning.
Independent variables: age, reason for stay, pre-existing conditions
Dependent variable: length of hospital stay
Forecast the duration of a patient's stay to enhance hospital efficiency.
Input the patient's characteristics (age, reason for stay, pre-existing conditions) into the regression model.
These are the independent variables used for prediction.
The model outputs the predicted length of stay.
This is the dependent variable being forecasted.
Use the predicted stay duration to optimize bed planning.
This represents the application-oriented goal of enhancing efficiency.
The regression model provides a predicted stay duration, allowing the hospital to optimize bed planning.
The video explicitly links this prediction to optimizing bed planning and enhancing efficiency.
Or as an operator of an online store, you are very interested in which product a person is most likely to buy. You want to suggest this product to the visitor in order to increase the sales of the online store.
What product is a person most likely to buy from an online store?
Predict which product a visitor is most likely to buy from an online store in order to suggest it and increase sales.
Independent variables: visitor characteristics (implied)
Dependent variable: product most likely to buy
Forecast purchasing behavior to increase online store sales.
Analyze visitor data to predict the most likely product to be purchased.
Using regression for predictive modeling.
Suggest the predicted product to the visitor.
Applying the prediction to a practical business scenario.
Increase the overall sales of the online store.
The ultimate application-oriented goal of the prediction.
The model predicts the most likely product for a visitor to buy, enabling targeted suggestions that increase sales.
The video categorizes this as a highly application-oriented use case focused on efficiency and sales.
"...either if a person has studied or not, the weekly working hours, or the age of a person."
Single predictor icons in the left panel point to coins.
Identify what kind of single predictor is used in the simple linear regression illustration.
One independent variable is used.
Possible examples include education status, weekly working hours, or age.
Illustrate simple linear regression with a single predictor.
Select one predictor variable from the listed examples.
The narration says only one variable is used in simple linear regression.
Use that single predictor to infer the metric outcome represented by coins.
The visual arrow points from one input icon to the coin stack.
Simple linear regression is illustrated by using one predictor such as education, weekly working hours, or age.
Matches the left panel labeled "Simple linear Regression" and the narration about using only one variable.
"...the highest level of education, the number of hours worked per week, and the age of the person."
Three predictor icons converge on coins in the middle panel.
Identify the set of predictors used in the multiple linear regression illustration.
Several independent variables are used.
Examples named are highest level of education, number of hours worked per week, and age.
Illustrate multiple linear regression with several predictors.
Combine the three named predictors into one model.
The narration explicitly lists them together for multiple linear regression.
Use the combined predictors to predict the metric outcome shown as coins.
All three arrows point to the same coin stack.
Multiple linear regression is illustrated by using education level, weekly hours worked, and age together.
Matches the middle panel labeled "Multiple linear Regression" and the spoken list of several independent variables.
"Metric variables are for example the salary of a person, the body size, or the electricity consumption."
Slide title "Metric variables" with labels Salary, Body size, Electricity.
Provide examples of metric variables as used in the clip.
The dependent variable in linear regression is metric.
Name concrete metric-variable examples.
List salary as one metric example.
Directly stated in audio and shown on screen.
List body size as another metric example.
Directly stated in audio and shown on screen.
List electricity consumption as a third metric example.
Directly stated in audio and shown on screen.
Salary, body size, and electricity consumption.
Exactly matches the "Metric variables" slide and narration.
"Categorical variables are for example if a person is at risk of burnout or not, if a person is diseased or not, or type of animal."
Slide title "Categorical Variable" with labels Risk of burnout, Diseased or not, Animal.
Provide examples of categorical variables as used in the clip.
Logistic regression is used for categorical dependent variables.
Name concrete categorical-variable examples.
List risk of burnout as one categorical example.
Directly stated in audio and shown on screen.
List diseased or not as another categorical example.
Directly stated in audio and shown on screen.
List type of animal as a third categorical example.
Directly stated in audio and shown on screen.
Risk of burnout, diseased or not, and type of animal.
Exactly matches the "Categorical Variable" slide and narration.
"...two possible values like yes or no, success or failure, or diseased and not diseased."
Paired labels Yes/No, Success/Failure, Not Diseased/Diseased appear beside the two faces.
Identify example value pairs for a binary outcome.
The outcome variable is binary.
It has two possible values.
Illustrate binary outcomes with paired labels.
Use Yes and No as one binary pair.
Shown on screen and named in narration.
Use Success and Failure as another binary pair.
Shown on screen and named in narration.
Use Diseased and Not Diseased as a third binary pair.
Shown on screen and named in narration.
Yes/No, Success/Failure, and Diseased/Not Diseased.
Matches the binary logistic regression slide and the spoken examples.
"...such as gender with male and female. In this case we can code one..."
Male and female icons appear, followed by the numeral 0.
The coding explanation is incomplete because the clip ends before the second code is shown.
Identify the example used for a categorical predictor with two levels.
Categorical predictors in regression are restricted to two categories or levels.
The example given is gender.
Show a two-level categorical predictor example.
Take gender as the categorical predictor.
The narration explicitly names gender with male and female.
Note that it has two levels: male and female.
The two icons are shown side by side.
Begin assigning numeric codes, with 0 displayed first.
The final frame shows 0 beneath the icons while the narration starts discussing coding.
Gender with male and female is used as the two-level categorical predictor example, and coding begins with 0.
Matches the final slide text and icons, though the full coding scheme is not completed in the clip.
Narrator uses 'vehicle type' as an example of a variable with more than two categories.
Icons of a car, a bus, and a convertible are shown under the heading 'Vehicle type'.
How to handle a variable with more than two categories, such as vehicle type, in a regression model?
Variable: Vehicle type
Categories: Car, Bus, Convertible (more than two)
Represent the categorical variable in the model.
Create dummy variables to represent the different categories of the vehicle type.
Dummy variables allow categorical data with multiple levels to be included in regression models.
Use dummy variables.
No verification step is shown in the source.
A scatter plot with several teal points and a yellow upward-sloping straight line appears above the title 'Regression Analysis'.
teal axes
teal data points
yellow straight line
title text 'Regression Analysis'
The title is introduced under the scatter plot.
The plotted line rises from left to right.
The points are scattered around the line rather than lying exactly on it.
The image gives a visual preview of regression as fitting a line through scattered observations.
Four playlist items appear in sequence: 'What is a Regression Analysis?', 'What is Simple Linear Regression?', 'What is Multiple Linear Regression?', and 'What is Logistic Regression?'.
The first item is highlighted while the others fade.
four playlist titles
highlighted first item
faded remaining items
The four topics appear one after another.
The first topic remains emphasized while the others become lighter.
The order of topics stays fixed.
The slide situates this clip as the introductory part of a larger regression series.
A webpage for 'Statistics made easy' is shown with the book cover and purchase buttons.
If you like, you can find the content of this video in our book, Statistics Made Easy.
webpage screenshot
book cover 'Statistics made easy'
buttons 'Buy now' and 'Free sample'
The video cuts from the playlist slide to the website view.
The page promotes the companion book.
This segment is promotional and does not add mathematical content beyond identifying a companion resource.
Three icons on the left point toward a coin stack on the right.
Labels identify the left icons as 'Highest level of education', 'Weekly working hours', and 'Age'.
Text identifies the right side as the dependent variable and the left side as independent variables.
Additional synonym labels appear beneath each side.
scroll icon
clock icon
elderly person icon
coin stack icon
arrows
labels for variable roles and synonyms
The generic three-to-one diagram is introduced.
Specific labels are added to the left icons.
Role labels are added to both sides.
Synonym lists are appended under each role.
The arrows consistently point from the three left icons to the single right icon.
The diagram encodes the regression structure: multiple predictors on the left relate to one outcome on the right.
A hand sign with two fingers appears above the sentence 'Regression analysis can be used to achieve two goals.'
A numbered list then shows goal 1 and goal 2.
The word 'Example' appears vertically at the left near the end.
two-finger hand icon
numbered list items 1 and 2
vertical word 'Example'
The two-goals statement appears first.
Goal 1 is shown.
Goal 2 is shown.
The word 'Example' appears as a transition cue.
The two goals remain ordered as influence first and prediction second.
This slide summarizes the practical purposes of regression before moving into examples.
Three columns appear: Simple linear Regression (one clock icon pointing to coins), Multiple linear Regression (three icons pointing to coins), Logistic Regression (three icons pointing to smiley/sad faces). A yellow highlight box appears around the clock icon in the Simple linear Regression column.
Clock icon
Coins icon
Certificate icon
Person with cane icon
Smiley face icon
Sad face icon
Yellow highlight box
The video sequentially introduces three types of regression side-by-side.
A yellow highlight box specifically emphasizes the single independent variable (clock icon) in the simple linear regression model.
The directional arrows consistently point from independent variables to dependent variables across all three models.
The visual layout contrasts the number and type of independent variables with the nature of the dependent variable. Simple linear regression uses one continuous predictor for a continuous outcome (coins). Multiple linear regression uses multiple continuous predictors for a continuous outcome. Logistic regression uses multiple predictors for a categorical/binary outcome (smiley/sad faces). The highlight reinforces the 'simple' aspect of using just one independent variable.
Three columns labeled Simple linear Regression, Multiple linear Regression, and Logistic Regression appear side by side.
Highlighting shifts among panels and yellow boxes mark selected elements.
Title "Simple linear Regression"
Title "Multiple linear Regression"
Title "Logistic Regression"
Clock icon
Diploma icon
Elderly person icon
Coin stack
Smiley face
Frowny face
Teal arrows
Yellow highlight boxes
The left panel is emphasized first for simple linear regression.
The middle panel is emphasized next for multiple linear regression.
Yellow boxes then compare one predictor versus several predictors.
Yellow boxes also compare the shared coin outcome in the two linear models.
Arrows consistently run from predictors on the left to outcomes on the right.
Coins represent the metric outcome in both linear-regression panels.
Faces represent the categorical outcome in the logistic panel.
The animation establishes the taxonomy of regression types by varying the number of predictors and the type of outcome.
Full-screen slide titled "Metric variables".
The outcome icon changes from coins to tape measure to battery/electricity symbol while the label changes accordingly.
Title "Metric variables"
Diploma icon
Clock icon
Elderly person icon
Coin stack
Tape measure
Electricity/battery icon
Labels Salary, Body size, Electricity
The outcome example changes from Salary to Body size to Electricity.
The three predictor icons remain on the left.
The arrows still point toward the changing outcome.
The slide concretizes what counts as a metric dependent variable by cycling through quantitative examples.
Full-screen slide titled "Categorical Variable".
Example groups appear sequentially: Risk of burnout, Diseased or not, Animal.
Title "Categorical Variable"
Smiley/frowny faces
Bed with X/check icon
Animal icons
Labels Risk of burnout, Diseased or not, Animal
New categorical examples are added one after another across the slide.
All examples are qualitative outcome categories rather than measured quantities.
The animation broadens the notion of categorical outcomes beyond binary disease status to include other class-based variables.
Slide with three predictors pointing to two faces and text "Binary Logistic Regression".
Yellow box highlights the two faces; text changes from "Outcome variable is binary" to "Two possible values"; paired labels cycle through Yes/No, Success/Failure, Not Diseased/Diseased.
Diploma icon
Coin stack icon
Elderly person icon
Smiley face
Frowny face
Yellow highlight box
Text "Binary Logistic Regression"
Text "Outcome variable is binary"
Text "Two possible values"
Paired labels Yes/No, Success/Failure, Not Diseased/Diseased
The outcome pair is boxed to emphasize binarity.
Explanatory text changes from binary outcome to two possible values.
Example label pairs cycle in place.
There are always exactly two outcome faces.
The predictors remain three in number.
The visual sequence defines binary logistic regression by focusing on the two-valued nature of the outcome.
Three-panel summary slide with labels metric under coin outcomes, nominal under face outcomes, and metric/ordinal/nominal under predictor groups.
Yellow boxes highlight predictor groups and then the outcome labels.
Simple linear Regression panel
Multiple linear Regression panel
Logistic Regression panel
Label metric
Label nominal
Labels metric, ordinal, nominal under predictors
Yellow highlight boxes
Outcome labels are added under the right-side variables.
Measurement-level labels are added under the left-side predictor groups.
Highlight boxes move to compare predictors and outcomes.
Linear-regression outcomes stay labeled metric.
Logistic-regression outcome stays labeled nominal.
Predictor groups are shown as capable of multiple measurement levels.
The slide consolidates the clip's main classification rule: outcome type distinguishes linear from logistic regression, while predictors are more flexible.
Text "Categorical variables with two levels." then male/female icons and the numeral 0.
The screen clears from the three-panel summary to a focused explanation of categorical predictors.
The second numeric code is not shown before the clip ends.
Text "Regression"
Text "Categorical variables with two levels."
Male icon
Female icon
Numeral 0
Curved teal arrow
The broad comparison view is replaced by a focused statement about categorical predictors.
Male and female icons appear as the two levels.
The numeral 0 is introduced beneath them.
The example remains a two-category variable.
The focus stays on predictor coding rather than outcome type.
The ending narrows the earlier flexibility claim by imposing a two-level restriction on categorical predictors and beginning to show numeric coding.
Depending on your field, independent variables may also be called predictor variables or input variables.
While the dependent variable might be referred to as the response, output or target variable.
One might think that terms such as predictor, input, response, outcome, or target denote different concepts from independent and dependent variables.
The video explains that these are alternative field-specific names for the same roles: independent variables may be called predictor or input variables, and the dependent variable may be called response, output, or target variable.
But in this case you're not interested in predicting children's ability to concentrate.
But you are not interested in predicting children's ability to concentrate.
Assuming that all regression analysis is used for predicting outcomes.
Regression can be strictly research-based to measure the influence of variables on each other, without any intent to predict the dependent variable's exact value.
The narrator first says independent variables can be nominal, ordinal, or metric, then immediately corrects with "Okay, actually in regression you can only use categorical variables with two categories or levels..."
One might infer from the general statement that independent variables can be nominal, ordinal, or metric that categorical predictors with any number of levels are directly usable in regression.
The clip explicitly revises this by stating that categorical variables used in regression must have only two categories or levels.
The narration first contrasts simple and multiple regression by number of predictors, then contrasts linear and logistic regression by dependent-variable type.
Summary labels metric for linear outcomes and nominal for logistic outcome.
A viewer might think the main distinction among these methods is only how many predictors are used.
The clip shows that simple vs multiple concerns the number of independent variables, while linear vs logistic concerns whether the dependent variable is metric or categorical.
Logistic regression is first defined for categorical dependent variables, then binary logistic regression is specified as the case where the outcome has two possible values.
General categorical examples include animal type, while the binary section shows only paired outcomes.
Because binary logistic regression is highlighted as the most common form, one might conflate logistic regression in general with only two-outcome cases.
The clip distinguishes logistic regression for categorical outcomes from binary logistic regression, whose outcome specifically has two possible values.
The definition first says regression predicts a variable, and later names that variable the dependent variable.
The general definition of regression analysis includes the role of the variable being inferred or predicted, which the video then names the dependent variable.
The definition mentions using one or more other variables, and later names those variables independent variables.
The definition of regression analysis includes the set of variables used for prediction, which the video then names independent variables.
Independent variables may also be called predictor variables or input variables.
The alternative names are presented as equivalent labels for the same role of variables used for prediction.
The dependent variable might be referred to as the response, output or target variable.
The alternative names are presented as equivalent labels for the same role of the variable being inferred or predicted.
The definition says regression can infer or predict a variable; the later list separates influence measurement and prediction as two goals.
The two-goal list operationalizes the broad definition by specifying the main ways regression analysis is used.
The salary example assigns salary as the outcome and education, hours, and age as predictors.
The salary example instantiates the dependent-variable concept with salary as the predicted outcome.
The salary example uses highest level of education, weekly working hours, and age for prediction.
The salary example instantiates the independent-variable concept with education, working hours, and age as predictors.
Now there are different types of regression analysis. There is the simple linear... In simple linear regression, we use just one independent variable to predict the dependent variable.
Simple linear regression is a specific methodological implementation of the broader concept of using regression for prediction, restricted to exactly one independent variable.
Now there are different types of regression analysis. There is the simple linear, multiple linear, and logistic regression.
The general category of regression analysis types contains simple linear regression as one of its primary classifications.
The narration moves from one variable in simple linear regression to several variables in multiple linear regression.
Left panel has one predictor; middle panel has three predictors.
Multiple linear regression extends simple linear regression by allowing several independent variables instead of one.
"Both have in common that the dependent variable is metric."
The shared metric-dependency property applies to simple linear regression as part of the linear-regression family.
"Both have in common that the dependent variable is metric."
The same shared metric-dependency property also applies to multiple linear regression.
A regression analysis is a method for modeling relationships between variables.
The variable we want to infer or predict is called the dependent variable. The variables used for prediction are called independent variables.
Depending on your field, independent variables may also be called predictor variables or input variables.
While the dependent variable might be referred to as the response, output or target variable.
1 Measure the influence of one or more variables on another variable. 2 Prediction of one variable by one or more other variables.
For example, you could take the highest level of education, the weekly working hours, and the age of a person.
Let's start by measuring the influence of one or more variables on another.
In simple linear regression, we use just one independent variable to predict the dependent variable.
Logistic Regression column shows icons pointing to smiley and sad faces.
Narration defines simple linear regression as using only one variable.
Left panel labeled "Simple linear Regression".
Narration says multiple linear regression uses several independent variables.
Middle panel labeled "Multiple linear Regression".
"Both have in common that the dependent variable is metric."
Coin outcome highlighted in both linear panels.
Examples: salary, body size, electricity consumption.
Slide titled "Metric variables".
Covered · Opening visual preview of regression with scatter plot and fitted line; no explicit spoken definition yet.
Covered · Playlist overview naming later topics in the series; contextual only.
Covered · Promotional segment for the companion book 'Statistics made easy'; no new mathematical content.
Covered · Transition slide introducing the first question.
Covered · Core definition of regression analysis is given.
Covered · Salary example illustrates variables used for prediction and the outcome variable.
Covered · Formal naming of dependent and independent variables plus field-specific synonyms.
Covered · Transition question asking when regression analysis is used.
Covered · Two stated goals of regression analysis are listed, followed by a transition to examples.
Covered · Covers the first use case of regression: measuring influence, including two examples and a misconception clarification.
Covered · Covers the second use case of regression: prediction, including two application-oriented examples.
Covered · Introduces the different types of regression analysis and defines simple linear regression with visual comparisons.
Covered · Defines simple linear regression as using one independent variable and shows the left panel example.
Covered · Defines multiple linear regression as using several independent variables and shows the middle panel example.
Covered · Explicitly compares one versus several predictors and identifies the shared metric dependent variable.
Covered · Introduces metric variables with salary, body size, and electricity examples.
Covered · Switches to logistic regression and categorical dependent variables with examples.
Covered · Defines binary logistic regression and illustrates two-valued outcomes.
Covered · Summarizes metric versus categorical/nominal dependent variables across model families.
Covered · States that independent variables can be nominal, ordinal, or metric.
Covered · Refines the rule to two-level categorical predictors, gives gender as example, and begins numeric coding with 0.
Covered · Introduction to binary categorical variables (0 and 1).
Covered · Explanation of dummy variables for multi-category variables.
Covered · Transition to the recap section.
Covered · Definition and example of simple linear regression.
Covered · Definition and example of multiple linear regression.
Covered · Definition and example of logistic regression.
Covered · Outro, playlist navigation, and end screen.
Reviewed English material v1: card/concept_card "Definition of regression analysis" starting at 0:33 — Regression analysis is presented as a method for modeling relationships between variables. Its function is to infer or predict one variable using one or more other variables.
Reviewed English material v1: card "Simple Linear Regression Definition" at 3:52 — Simple linear regression is a specific predictive model that utilizes exactly one independent variable to forecast a dependent variable. Visually, it is represented by a single input factor pointing to a continuous numerical outcome.
 YouTube3:54
Another explanation of Regression modeling.
Regression modelingAnother explanation of Linear regression.
Linear regression YouTube3:40
Another explanation of Regression modeling.
Regression modeling YouTube6:05
Another explanation of Regression modeling.
Regression modelingYouTube3:54Next in Mathematical modeling: Regression modeling → Least squares and residual diagnostics.
Least squares and residual diagnostics · View learning sequence YouTube3:07
Next in Mathematical modeling: Regression modeling → Least squares and residual diagnostics.
Least squares and residual diagnostics · View learning sequence YouTube8:04
Next in Mathematical modeling: Regression modeling → Least squares and residual diagnostics.
Least squares and residual diagnostics · View learning sequence YouTube7:04
Application of Regression modeling, complementing the current explanation.
Regression modelingYouTube6:05Whiteboard for Regression modeling, compared with the current visual explanation.
Regression modeling YouTube4:47
Lecture for Regression modeling, compared with the current visual explanation.
Regression modeling