Reviewed learning material · Video analysis · EnglishRead the full overview
This 120-second clip explains how to add a construction delay to a housing stock-and-flow model. The lecturer states that houses do not appear instantly and uses a one-year building time as the model assumption. He introduces a work-in-progress stock, House WIP, and describes delay as a chain of stocks, here a two-stock chain of unfinished and finished houses. On the whiteboard he keeps the goal-gap-builders control structure, relabels the original Houses stock as House WIP, and draws a new outflow labeled Completing houses to represent completion after 12 months.
This segment demonstrates how to model production delays in System Dynamics by introducing a 'Work In Progress' (WIP) stock. The instructor adds a 'Finished Houses' stock and rewires the 'Gap' calculation to depend on finished supply rather than WIP. He defines the completion rate as the WIP stock divided by the average completion time (12 months), illustrating the standard first-order delay formulation.
This segment extends a system dynamics model of the housing market by introducing a decay mechanism for finished houses. The instructor explains how to model the 'scrap/decay' flow using a time constant derived from the average lifetime of a house (36 months). He demonstrates that dividing the stock of finished houses by 36 yields the monthly decay rate, equivalent to 1/36th of the houses decaying per month. This reinforces the general principle of using average delay times to formulate flow rates in first-order delays.
This introductory segment features a lecturer presenting a hand-drawn stock-and-flow diagram on a whiteboard. The model represents a housing market with two primary stocks: 'House WIP' (work-in-progress) and 'Finished Houses'. Flows include 'Building rate', 'Completion rate', and 'Sales rate'. Crucially, the diagram annotates significant time delays: 3 months for construction and 30 months for sales. A feedback loop involves a 'GOAL' of 10,000 houses and a calculated 'Gap'. The speaker explains that this structure will be used to demonstrate how delays influence the system's attempt to reach its target, setting the stage for analyzing potential oscillations.
Use the learning inspector for key ideas and moments, or open the reading tabs for the complete notes.
Generated from the video's visuals and explanation; not verbatim speech.
The lecturer begins by saying the model will be made more interesting by including the delay discussed earlier. The visible whiteboard already contains a stock-and-flow structure with GOAL (Population), Gap (Land for houses), Builders, Smooth Adj Time, and a stock labeled Houses.
He states the key modeling issue: houses do not simply appear when builders act, because construction takes time. In this simplified model the delay is set to one year from start to finish, though he notes real construction could last longer.
To represent that delay, he introduces a work-in-progress stock. Instead of treating started construction as immediate output, the model first accumulates houses that are under construction but not yet complete.
He then generalizes the mechanism: a delay can be handled as a chain of stocks. For this example the chain has only two links, House WIP followed by finished houses, which he says is adequate for the present model.
Turning to the board, he preserves the upstream control logic from goal to gap to builders. The change happens at the destination of the Builders inflow: the old Houses stock is relabeled House WIP, making it the stock of unfinished construction.
As he explains, once builders start a house it does not become a finished house immediately; it becomes a house work in progress. This verbal point matches the board edit where the first stock is renamed WIP.
Finally he draws a new outflow from House WIP and labels it Completing houses, corresponding to the statement that after 12 months the houses are completed. The clip ends while this revised delay structure is being drawn.
The instructor begins by drawing a new stock box labeled 'Finished Houses' to the right of the 'House WIP' box. This visually separates the concept of houses currently under construction from those that are fully completed and ready for occupancy.
Next, the instructor performs a 'rewiring' operation. He draws an arrow from the 'Finished Houses' stock to the 'Gap' variable. He explains that the 'Gap'—the difference between demand and supply—must be calculated based on the number of *finished* houses available, not the work-in-progress. He provides a numerical example: if the goal is 10,000 families and there are 1,000 finished houses, the gap is 9,000.
The focus shifts to the flow valve labeled 'Completing houses'. The instructor writes 'Completion Time' next to it and states it is 12 months. He explains the mathematical relationship governing this flow: the rate at which houses leave the WIP stock and enter the Finished stock is equal to the current level of the WIP stock divided by the completion time. Thus, Rate=12House WIP.
He generalizes this principle, stating that in System Dynamics, delays are modeled by dividing the stock level by the average delay time to determine the outflow rate. This creates a first-order delay structure where the 'House WIP' acts as a buffer accumulating items before they are processed and moved to the next stage.
The instructor begins by reviewing the calculation for the completion rate of houses. He points to the 'House WIP' stock and explains that the outflow is determined by dividing the current stock by the average build time, which is 12 months. This results in a completion rate of 1/12 of the WIP per month.
Next, he introduces a new element to the model: a decay rate for finished houses. He draws a valve exiting the 'Finished Houses' stock, labeling it 'Scrap/decay'. He explains that houses do not last forever; in this simplified model, they have an average lifetime of three years, or 36 months.
Applying the same logic used for construction, he formulates the decay rate. He states that the number of houses decaying per month is found by dividing the 'Finished Houses' stock by the average lifetime of 36 months. Mathematically, this means 1/36 of the existing houses decay each month.
He addresses a potential confusion, noting that while treating a fixed lifetime as a fractional monthly decay might seem counter-intuitive, it is mathematically equivalent in continuous system dynamics models. He summarizes the three time constants in the model: 3 months for the builder's response delay, 12 months for the construction delay, and 36 months for the housing decay delay.
The lecturer stands before a whiteboard displaying a system dynamics model. He concludes a previous thought about monthly rates.
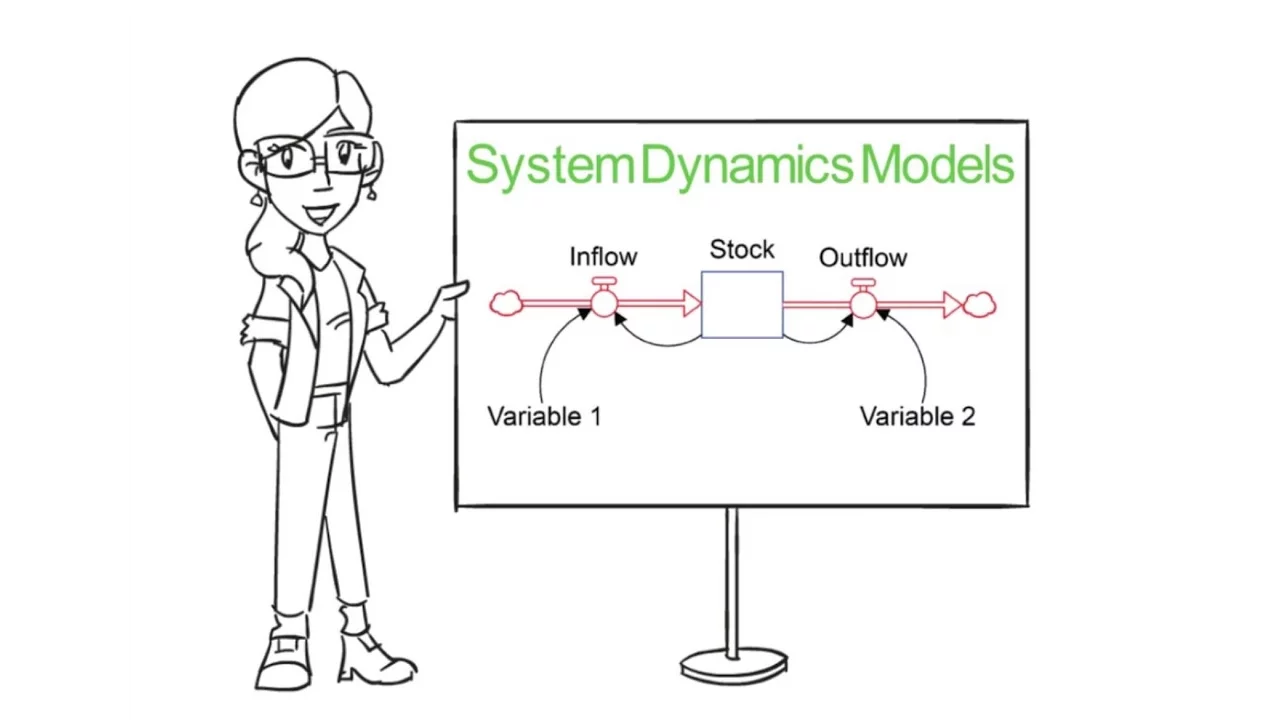
He identifies the drawing as a 'stock-and-flow diagram,' acknowledging that new elements have been added which might cause confusion. The diagram clearly shows rectangles for stocks ('House WIP', 'Finished Houses') and arrows for flows ('Building rate', 'Completion rate', 'Sales rate').
The speaker proposes enhancing the model using this specific diagram. He points out the annotations indicating delays: '3 months Avg Time' for construction and '30 months (sales)' for selling. He also highlights the feedback mechanism involving a 'GOAL (10,000)' and the resulting 'Gap'.
He explains the purpose of this setup: to observe how the system behaves as it attempts to reach the target of 10,000 houses, implying that the delays will play a critical role in this dynamic process.
Knowledge cards
01
Construction delay in the housing model
The lecture adds realism by recognizing that houses are not created instantaneously. In the model, starting construction and finishing construction are separated by one year, although the lecturer notes actual building times may be longer.
02
House WIP as a work-in-progress stock
A work-in-progress stock stores items that have entered the production process but are not yet finished. Here House WIP represents houses under construction, so the Builders inflow adds to unfinished inventory rather than directly to completed houses.
03
Delay as a chain of stocks
The lecturer explains that time delays can be modeled by chaining stocks so that units move through successive stages before reaching the final stock. This example uses a two-stock chain: House WIP and then finished houses.
04
Revised whiteboard structure
On the board, the existing goal-gap-builders feedback path is kept, but the original Houses stock is relabeled House WIP. A new outflow labeled Completing houses is drawn from that stock to represent completion after the one-year delay.
05
Modeling Delays with WIP Stock
In System Dynamics, processes that take time (like building a house) are modeled by inserting a 'Work In Progress' (WIP) stock. This stock accumulates items as they enter the process and depletes as they finish. It acts as a buffer between the start and end of the activity.
06
Calculating Outflow Rate from Delay
The rate at which items leave a delay stock (e.g., 'Completing houses') is calculated by dividing the current stock level by the average time it takes to complete the process. Formula: Outflow Rate=Average Delay TimeStock Level.
Outflow Rate=Average Delay TimeStock Level
07
Defining the Gap Variable
The 'Gap' represents the discrepancy between a target goal and current performance. In this housing model, it is crucial to calculate the gap using 'Finished Houses' (actual supply) rather than 'House WIP', as only completed houses satisfy demand. Gap=Goal−Finished Houses.
Gap=Goal−Finished Houses
08
Time Constant in First-Order Delays
In system dynamics, a first-order delay is modeled by dividing the stock level by the average delay time (time constant). For example, if the average build time is 12 months, the completion rate is 12House WIP.
Rate=Average Delay TimeStock
09
Modeling Decay with Average Lifetime
To model the removal of items from a stock (like houses decaying), use the average lifetime as the time constant. If the average lifetime is 36 months, the decay rate is 36Finished Houses, meaning 1/36 of the stock decays per month.
Decay Rate=Average LifetimeStock
10
Equivalence of Lifetime and Fractional Decay
It is a common misconception that a fixed lifetime (e.g., 36 months) cannot be represented by a fractional decay rate (1/36 per month). In continuous exponential decay models, these two formulations are mathematically equivalent.
11
Stock-and-Flow Diagram Structure
A modeling tool where rectangles represent accumulations (stocks like 'House WIP'), thick arrows represent rates of change (flows like 'Building rate'), and thin lines represent information links. Valves on flow arrows indicate control points.
12
Time Delays in Systems
Explicit lags between cause and effect. In this housing model, there is a 3-month delay for construction and a 30-month delay for sales. These delays prevent instantaneous adjustment to changes in demand or supply.
13
Goal-Seeking Feedback Loop
A regulatory mechanism where the system compares its current state against a target ('GOAL = 10,000'). The difference ('Gap') drives adjustments in inflow rates (like 'Building rate') to reduce the discrepancy over time.
Detailed learning notes
Explore conditions, steps and evidence. Supplementary explanations are labeled separately from content shown in the video.
Symbols · 31
Houses
Clear evidence
Shown in the video
Evidence
Diagram
Observation
Whiteboard shows a rectangular stock labeled "Houses".
Symbol
Houses
Meaning
Stock of finished houses in the system dynamics model.
Domain
Count of completed houses.
Builders
Clear evidence
Shown in the video
Evidence
Diagram
Observation
Whiteboard shows a valve/flow labeled "Builders" entering the Houses stock.
Whiteboard shows "Smooth Adj Time" connected to the Builders flow.
Symbol
Smooth Adj Time
Meaning
Adjustment time parameter controlling how quickly builders respond to the gap.
Gap
Clear evidence
Shown in the video
Evidence
Diagram
Observation
Whiteboard shows "Gap (Land for houses)" feeding into the Builders flow.
Symbol
Gap
Meaning
Difference between desired housing/land and current stock, driving construction.
Goal
Clear evidence
Shown in the video
Evidence
Diagram
Observation
Whiteboard shows "GOAL (Population)" pointing toward the Gap.
Symbol
Goal
Meaning
Target population or housing requirement used to compute the gap.
House WIP
Clear evidence
Shown in the video
Evidence
Diagram
Observation
Lecturer writes "House WIP" inside the former Houses box.
Audio
Observation
Lecturer says it becomes a house work in progress, WIP.
Symbol
House WIP
Meaning
Stock of houses under construction, introduced to represent building delay.
Domain
Count of unfinished houses.
Completing houses
Clear evidence
Shown in the video
Evidence
Diagram
Observation
Lecturer draws an outflow from House WIP and labels it "Completing houses".
Audio
Observation
Lecturer says after 12 months they are completing the houses.
Symbol
Completing houses
Meaning
Outflow rate from House WIP to finished houses.
House WIP
Clear evidence
Shown in the video
Evidence
Diagram
Observation
Rectangular box labeled 'House WIP'
Symbol
House WIP
Meaning
Stock representing the number of houses currently under construction (Work In Progress).
Domain
Non-negative integer count of houses.
Finished Houses
Clear evidence
Shown in the video
Evidence
Diagram
Observation
Rectangular box labeled 'Finished Houses'
Symbol
Finished Houses
Meaning
Stock representing the cumulative number of completed houses.
Domain
Non-negative integer count of houses.
Gap
Clear evidence
Shown in the video
Evidence
Diagram
Observation
Text label 'Gap' with an arrow pointing to it from 'Goal (Population)' and 'Finished Houses'
Symbol
Gap
Meaning
Difference between the target population (goal) and the current number of finished houses.
Domain
Number of households/families.
Goal (Population)
Clear evidence
Shown in the video
Evidence
Diagram
Observation
Text label 'Goal (Population)'
Symbol
Goal (Population)
Meaning
Target number of households or families that need housing.
Domain
Number of households/families.
3 months Adj Time
Clear evidence
Shown in the video
Evidence
Diagram
Observation
Text label '3 months Adj Time'
Symbol
3 months Adj Time
Meaning
Adjustment time parameter for the builders' goal closing rate.
Domain
Time in months.
Knowledge points · 10
Time delay in housing construction
Clear evidence
Shown in the video
Evidence
Audio
Observation
Lecturer says houses do not just appear; they take time to be built, with one year as the building time in the model.
Definition
Explanation
The model includes a delay because construction is not instantaneous. In this simplified version, one year passes between starting a house and finishing it.
Conditions
Model assumes a fixed building time of one year.
Real-world construction could take longer.
Work-in-progress stock
Clear evidence
Shown in the video
Evidence
Audio
Observation
Lecturer explains handling delay by doing a work in progress notion, with a stock of houses being built but not yet finished.
Diagram
Observation
Later whiteboard edit labels the first stock as House WIP.
Definition
Explanation
A work-in-progress stock holds items that have entered the process but have not yet become final output. Here it represents houses under construction.
Conditions
Used when a flow does not immediately produce the final stock.
Prerequisites
Time delay in housing construction
Delay as a chain of stocks
Clear evidence
Shown in the video
Evidence
Audio
Observation
Lecturer says the delay is almost a chain of stocks, in this case just a two chain: house in progress and finished house.
Method
Explanation
Delays can be represented by chaining stocks so material moves from one stock to the next over time. This example uses a two-stock chain.
Conditions
At least one intermediate stock is needed before the final stock.
Prerequisites
Work-in-progress stock
Stock and Flow Model Structure
Clear evidence
Shown in the video
Evidence
Audio
Observation
Speaker explains adding stocks for Work in Progress and Finished Houses.
Diagram
Observation
Whiteboard shows boxes for 'House WIP' and 'Finished Houses' connected by flows.
Definition
Explanation
The system is modeled using stocks (accumulations) and flows (rates of change). 'House WIP' accumulates via 'Building houses' and depletes via 'Completing houses'. 'Finished Houses' accumulates via 'Completing houses'.
Formula
Conditions
Stocks represent quantities at a point in time.
Flows represent rates of change over time.
Representing Delays with Stocks
Clear evidence
Shown in the video
Evidence
Audio
Observation
Speaker states 'once you're up and running, you're going to complete one twelfth of this inventory... each month.'
Diagram
Observation
Valve symbol labeled 'Completing houses' with 'Completion Time' parameter.
Method
Explanation
Delays in processes (like building a house) are represented by inserting a stock (Work In Progress) between the inflow and outflow. The outflow rate is calculated as the stock level divided by the average delay time.
Formula
Outflow Rate=Average Delay TimeStock Level
Conditions
Assumes a first-order delay or exponential distribution of completion times.
Applicable when the process has a significant duration.
A system dynamics model uses stocks (boxes) to represent accumulations, flows (valves) to represent rates of change, and information links (arrows) to show how variables influence decisions.
Formula
Conditions
Stocks accumulate over time.
Flows change the level of stocks.
Information links transmit values without material flow.
Time Constant Formulation
Clear evidence
Shown in the video
Evidence
Audio
Observation
Speaker explains dividing the stock by the average time to find the monthly rate, e.g., 1/12 per month.
Formula
Explanation
In first-order delays, the outflow rate is calculated by dividing the current stock level by the average delay time (time constant). This represents the fraction of the stock that turns over per unit time.
Formula
Outflow Rate=Average Delay TimeStock Level
Conditions
Assumes exponential aging or a first-order linear delay approximation.
Time must be expressed in the same units as the desired rate (e.g., months).
Prerequisites
Stock and Flow Diagram Structure
Stock-and-Flow Diagram
Clear evidence
Shown in the video
Evidence
Audio
Observation
Speaker states: 'So that is a stock and flow diagram...'
Diagram
Observation
Whiteboard displays boxes (stocks), arrows (flows), valves, and information links.
Definition
Explanation
A visual representation used in system dynamics to model accumulations (stocks) and the rates of change (flows) between them. Stocks are depicted as rectangles, flows as thick arrows with valves, and auxiliary variables or goals as circles or text annotations connected by thin information links.
Conditions
Used to represent dynamic systems over time.
Time Delays in System Dynamics
Clear evidence
Shown in the video
Evidence
Diagram
Observation
Annotations '3 months Avg Time' and '30 months (sales)' indicate time delays in the processes.
Definition
Explanation
The elapsed time between an action (e.g., starting construction) and its result (e.g., completing a house). In the diagram, delays are explicitly annotated on the stocks, affecting how quickly the system responds to changes in flow rates.
Conditions
Delays cause lagged responses in the system state.
Prerequisites
Stock-and-Flow Diagram
Goal-Seeking Behavior
Clear evidence
Shown in the video
Evidence
Audio
Observation
Speaker mentions: 'as the system tries to reach 10,000 houses.'
Diagram
Observation
Diagram includes 'GOAL (10,000)' and 'Gap' feeding into decision logic.
Method
Explanation
A control mechanism where the system adjusts its inflow rates based on the discrepancy (gap) between a desired target (goal) and the current state. Here, the building rate is influenced by the gap between the goal of 10,000 houses and the actual number of finished houses.
Conditions
Requires a defined target and a measurable current state.
Prerequisites
Stock-and-Flow Diagram
Claims and conditions · 2
Two-stock representation is adequate for this model
Clear evidence
Shown in the video
Evidence
Audio
Observation
Lecturer states that for this model the delay can be handled as a two-chain of stocks.
Proposition
Statement
For this housing model, a two-stock chain consisting of House WIP and finished houses is adequate to represent the one-year building delay.
Hypotheses
Building time is modeled as one year.
Only a simple delay representation is required.
Quantifiers
For the model under discussion.
Equivalence of Average Lifetime and Decay Fraction
Clear evidence
Shown in the video
Evidence
Audio
Observation
Speaker states: 'mathematically that is equivalent... might sound funny, but that's been proven to be equivalent.'
Uncertainties
The specific mathematical proof is not shown, only asserted.
Proposition
Statement
Modeling a stock with an average lifetime of T months is mathematically equivalent to applying a fractional decay rate of 1/T per month.
Hypotheses
The system is modeled using continuous first-order differential equations.
Quantifiers
For any stock with a defined average lifetime T.
Derivations and proofs · 3
Modifying the stock-and-flow diagram to include delay
Clear evidence
Shown in the video
Evidence
Audio
Observation
Lecturer says once builders start building, it does not become a house; it becomes a house work in progress, then after 12 months they are completing the houses.
Diagram
Observation
Lecturer edits the diagram: changes Houses to House WIP, draws an outflow, and labels it Completing houses.
Uncertainties
The finished-house stock itself is not fully drawn before the clip ends.
Visual argument
Steps
Expression
Explanation
Keep the existing goal-to-gap-to-builders control structure unchanged.
Justification
Lecturer says the rest of this is okay: you have a goal, a gap to the goal, and that drives builders to build.
Shown in the video
Expression
Explanation
Change the destination of the Builders inflow from finished houses to a work-in-progress stock.
Justification
Lecturer says once they start building, it does not become a house; it becomes a house work in progress, WIP.
Shown in the video
Expression
Explanation
Add an outflow from House WIP labeled Completing houses.
Justification
Lecturer says after 12 months they are completing the houses.
Shown in the video
Conclusion
The delayed construction process is represented by moving new starts into House WIP and then transferring completed units out through a completion flow.
Derivation of Completion Rate
Clear evidence
Shown in the video
Evidence
Audio
Observation
Speaker derives the completion rate: 'complete one twelfth of this inventory... each month' and 'stock divided by the time is the amount you're going to complete'.
Diagram
Observation
Arrow from 'House WIP' to 'Completing houses' valve.
Intuitive argument
Steps
Expression
Completion Time=12 months
Explanation
The average time to complete a house is given as 12 months.
Justification
Stated by speaker and written on board.
Shown in the video
Expression
Completing Houses Rate=Completion TimeHouse WIP
Explanation
The rate at which houses are completed is the current inventory of work-in-progress divided by the average completion time.
Justification
Standard system dynamics formulation for a first-order delay.
Shown in the video
Expression
Completing Houses Rate=12House WIP
Explanation
Substituting the value, the rate is 1/12th of the WIP stock per month.
Justification
Arithmetic substitution.
Derived from the video
Conclusion
The flow 'Completing houses' is determined by dividing the 'House WIP' stock by the 'Completion Time' (12 months).
Derivation of Monthly Decay Rate
Clear evidence
Shown in the video
Evidence
Audio
Observation
Speaker derives the decay rate: 'take the stock divided by the 36 months... one thirty-sixth of those houses are going to decay each month.'
Intuitive argument
Steps
Expression
Decay Rate=36Finished Houses
Explanation
Divide the current stock of finished houses by the average lifetime of 36 months.
Justification
Definition of average delay/time constant.
Shown in the video
Expression
Fraction Decaying=361 per month
Explanation
This implies that 1/36th of the existing houses decay every month.
Justification
Algebraic rearrangement of the rate equation.
Shown in the video
Conclusion
The scrap/decay flow is proportional to the Finished Houses stock with a coefficient of 1/36.
Worked examples · 4
Housing model with one-year construction delay
Clear evidence
Shown in the video
Evidence
Audio
Observation
Lecturer uses the housing model with one-year building time as the example throughout.
Diagram
Observation
Whiteboard contains Goal, Gap, Builders, Smooth Adj Time, Houses/House WIP, and Completing houses.
Uncertainties
No numerical values are shown for goal, gap, or rates.
Problem
Modify a stock-and-flow housing model so that construction delay is explicitly represented.
Given
There is a goal related to population.
There is a gap driving builders.
Builders form an inflow.
Construction takes one year in the model.
Goal
Introduce a work-in-progress stock and completion flow to represent delayed house construction.
Steps
Expression
Explanation
Recognize that houses do not appear instantly when builders start them.
Justification
Stated directly by the lecturer.
Shown in the video
Expression
Explanation
Create a stock for houses under construction, labeled House WIP.
Justification
This is the work-in-progress notion introduced for delays.
Shown in the video
Expression
Explanation
Route the Builders inflow into House WIP instead of directly into finished houses.
Justification
Starting construction adds to the unfinished stock.
Shown in the video
Expression
Explanation
Add a Completing houses outflow from House WIP after the one-year delay.
Justification
After 12 months, houses are completed.
Shown in the video
Answer
The revised model uses a two-stock chain: House WIP followed by finished houses, linked by a completion flow.
Verification
The verbal explanation matches the whiteboard edits visible in the clip.
Calculating the Housing Gap
Clear evidence
Shown in the video
Evidence
Audio
Observation
Speaker gives numbers: '1,000 houses finished... 10,000 people families that want it... gap is 9,000'.
Problem
Determine the 'Gap' given specific values for Goal and Finished Houses.
Given
Goal (Population) = 10,000 families
Finished Houses = 1,000 houses
Goal
Calculate the Gap.
Steps
Expression
Gap=Goal (Population)−Finished Houses
Explanation
The gap is defined as the difference between the target population and the current supply.
Justification
Definition of Gap in the model.
Shown in the video
Expression
Gap=10,000−1,000
Explanation
Substitute the given values.
Justification
Arithmetic substitution.
Derived from the video
Expression
Gap=9,000
Explanation
Perform the subtraction.
Justification
Arithmetic calculation.
Derived from the video
Answer
The Gap is 9,000 families.
Verification
Matches the speaker's verbal statement.
Housing Market System Dynamics Model
Clear evidence
Shown in the video
Evidence
Diagram
Observation
Complete whiteboard diagram of the housing market model.
Audio
Observation
Speaker walks through the parameters: 3 months avg time, 12 months build time, 36 months life.
Problem
Model the dynamics of house construction, completion, and decay over time.
Given
Average time to attend to gap: 3 months
Average time to build a house: 12 months
Average lifetime of a house: 36 months
Goal
Define the flow rates based on stock levels and time constants.
Steps
Expression
Completion Rate=12House WIP
Explanation
Calculate the rate at which houses finish construction.
Justification
First-order delay formulation using the 12-month build time.
Shown in the video
Expression
Decay Rate=36Finished Houses
Explanation
Calculate the rate at which houses are scrapped.
Justification
First-order delay formulation using the 36-month lifetime.
Shown in the video
Answer
The model uses fractional turnover rates (1/12 and 1/36 per month) applied to their respective stocks to determine flow speeds.
Verification
Consistent with the speaker's explanation of dividing stock by average time.
Housing Market Model with Delays
Clear evidence
Shown in the video
Evidence
Diagram
Observation
Complete whiteboard drawing showing House WIP, Finished Houses, rates, delays, and goal.
Audio
Observation
Speaker refers to 'this particular stock and flow diagram' and 'reach 10,000 houses'.
Problem
Model the dynamics of a housing market where construction takes time and sales take time, aiming for a specific inventory level.
Given
Stocks: House WIP, Finished Houses
Flows: Building rate, Completion rate, Sales rate
Delays: 3 months for construction, 30 months for sales
Goal: 10,000 finished houses
Goal
Understand how the system behaves when trying to reach the goal given the delays.
Steps
Expression
Explanation
Identify stocks and flows in the diagram.
Justification
Visual inspection of whiteboard.
Shown in the video
Expression
Explanation
Note the time delays associated with each stock.
Justification
Annotations '3 months' and '30 months' visible on board.
Shown in the video
Expression
Explanation
Observe the feedback loop involving the Goal and Gap.
Justification
Arrows connect GOAL and Gap to the Building rate.
Shown in the video
Answer
The system exhibits delayed response due to construction and sales times, potentially leading to oscillations around the 10,000 house goal.
Verification
Consistent with video title 'Delays and Oscillation' and speaker's intent to enhance the model.
Visual events · 7
Initial stock-and-flow diagram before delay revision
Clear evidence
Shown in the video
Evidence
Diagram
Observation
Initial whiteboard shows a stock labeled Houses with inflow Builders, plus Smooth Adj Time, Gap (Land for houses), and GOAL (Population).
Objects
Houses stock
Builders inflow
Smooth Adj Time
Gap (Land for houses)
GOAL (Population)
Invariants
The control path from goal to gap to builders remains visible.
The original stock label is Houses before revision.
Interpretation
This is the pre-revision model in which construction appears to feed directly into the Houses stock.
Diagram revision introducing WIP and completion flow
Clear evidence
Shown in the video
Evidence
Animation
Observation
Lecturer turns to the board, erases part of the Houses label, writes House WIP, draws a rightward outflow, and labels it Completing houses.
Uncertainties
The downstream finished-house stock is not fully drawn within this clip.
Objects
House WIP stock
Builders inflow
Completing houses outflow
Gap
GOAL (Population)
Changes
Houses is relabeled as House WIP.
A new outflow arrow is added from the WIP stock.
The outflow is labeled Completing houses.
Invariants
The upstream goal-gap-builders structure stays in place.
Builders still enters the first stock.
Interpretation
The visual edit implements the delay by separating construction start from completion.
Adding the Finished Houses Stock
Clear evidence
Shown in the video
Evidence
Animation
Observation
Speaker draws a new rectangular box labeled 'Finished Houses' to the right of the existing diagram.
Audio
Observation
Speaker says 'move from a work in progress house to a finished house'.
Objects
Whiteboard marker
'Finished Houses' box
Changes
New stock box is drawn.
Arrow connects 'Completing houses' flow to the new box.
Invariants
Existing 'House WIP' stock remains unchanged.
Interpretation
This visual step introduces the final accumulation point in the production chain, separating the concept of 'in progress' from 'completed'.
Rewiring the Gap Calculation
Clear evidence
Shown in the video
Evidence
Animation
Observation
Speaker erases part of the previous connection to 'Gap' and draws a new arrow from 'Finished Houses' to 'Gap'.
Audio
Observation
Speaker says 'The gap is really identified from the number of finished houses relative to the population'.
Objects
Eraser
Arrows
'Gap' label
'Finished Houses' box
Changes
Connection source for 'Gap' changes from 'House WIP' (implied previously) to 'Finished Houses'.
Invariants
'Goal (Population)' remains a source for 'Gap'.
Interpretation
This corrects the model logic: the shortage (gap) should be measured against actual completed supply, not work-in-progress.
Adding the Decay Flow
Clear evidence
Shown in the video
Evidence
Animation
Observation
Speaker draws a valve exiting the 'Finished Houses' box and labels it 'Scrap/decay'.
Objects
Finished Houses box
Valve symbol
Sink cloud
Changes
A new outflow is added to the Finished Houses stock.
Invariants
The structure of the previous stocks remains unchanged.
Interpretation
Introduces the concept that finished goods leave the system over time, creating a new demand gap.
Specifying Average Lifetime
Clear evidence
Shown in the video
Evidence
Animation
Observation
Speaker writes '36 months (life)' next to the decay valve.
Objects
Text annotation
Changes
Numerical parameter 36 is assigned to the decay process.
Invariants
The valve symbol itself does not change.
Interpretation
Defines the time constant for the decay flow.
Whiteboard Display of Housing Model
Clear evidence
Shown in the video
Evidence
Diagram
Observation
Static shot of whiteboard with hand-drawn system dynamics model.
Objects
House WIP box
Finished Houses box
Building rate arrow
Completion rate arrow
Sales rate arrow
GOAL circle
Gap label
Changes
None; static image throughout the clip.
Invariants
Relative positions of all diagram elements remain constant.
Interpretation
Provides the structural basis for discussing delays and goal-seeking behavior in the system.
Misconceptions · 3
Assuming construction is instantaneous
Clear evidence
Shown in the video
Evidence
Audio
Observation
Lecturer says houses do not just appear; they take time to be built.
Misconception
One might think the Builders inflow immediately creates finished houses.
Clarification
The lecture explicitly introduces a delay and a House WIP stock because started houses are not finished houses yet.
Confusing WIP with Finished Supply
Clear evidence
Shown in the video
Evidence
Audio
Observation
Speaker explicitly rewires the model, stating the gap comes from finished houses, implying a previous state or common error where it might come from WIP.
Misconception
Thinking that the 'Gap' (shortage) should be calculated based on houses currently being built (WIP).
Clarification
The 'Gap' represents unmet demand, so it must be calculated based on 'Finished Houses' (actual supply) versus the 'Goal'.
Counter-intuitive Nature of Fractional Decay
Clear evidence
Shown in the video
Evidence
Audio
Observation
Speaker notes: 'might sound funny, but that's been proven to be equivalent.'
Misconception
Learners may find it strange that a house lasting 36 months translates to exactly 1/36th of houses decaying each month, expecting a fixed number instead.
Clarification
In continuous system dynamics models, exponential decay is the standard assumption for delays, making the fractional rate mathematically equivalent to the average lifetime.
Concept relations · 6
Time delay in housing construction → Work-in-progress stock
Clear evidence
Shown in the video
Evidence
Audio
Observation
Lecturer links the need to handle time delay to the work-in-progress notion.
Application
Explanation
The work-in-progress stock is the modeling device used to represent construction delay.
Work-in-progress stock → Delay as a chain of stocks
Clear evidence
Shown in the video
Evidence
Audio
Observation
Lecturer describes the delay as almost a chain of stocks, here a two chain.
Special case
Explanation
The housing example is a special case of delay modeling using a chain of stocks, here reduced to two stocks.
Delay as a chain of stocks → Modifying the stock-and-flow diagram to include delay
Clear evidence
Shown in the video
Evidence
Diagram
Observation
The board edit turns the single Houses stock into House WIP plus a completion outflow.
Application
Explanation
The abstract two-stock chain idea is applied concretely in the revised whiteboard diagram.
Representing Delays with Stocks → Stock and Flow Model Structure
Clear evidence
Shown in the video
Evidence
Audio
Observation
Discussion of 'work in progress bucket' and 'completion time'.
Application
Explanation
The method of representing delays (ki_delay_representation) is applied within the broader framework of Stock and Flow modeling (ki_stock_flow_model).
Time Constant Formulation → Stock and Flow Diagram Structure
Clear evidence
Shown in the video
Evidence
Audio
Observation
Speaker repeatedly refers to 'average time' as the divisor for stocks.
Application
Explanation
The time constant formula is the mechanism used to calculate flow rates within the stock and flow structure.
Time Delays in System Dynamics → Goal-Seeking Behavior
Clear evidence
Derived from the video
Evidence
Diagram
Observation
Delays are attached to stocks which mediate flows.
Audio
Observation
Speaker discusses enhancing the model to see changes as system reaches goal.
Application
Explanation
Time delays inherent in the construction and sales processes directly impact the effectiveness and stability of the goal-seeking feedback loop.
Find an answer · 10
What does House WIP mean in a stock-and-flow model?
Clear evidence
Shown in the video
Evidence
Audio
Observation
Lecturer defines the work in progress notion for houses being built but not finished.
Knowledge points
Work-in-progress stock
How is a one-year construction delay represented in this diagram?
Clear evidence
Shown in the video
Evidence
Audio
Observation
Lecturer explains that delay is handled by a chain of stocks and then draws it.
Knowledge points
Time delay in housing construction
Delay as a chain of stocks
Modifying the stock-and-flow diagram to include delay
Why should builders not flow directly into finished houses?
Clear evidence
Shown in the video
Evidence
Audio
Observation
Lecturer says once they start building, it does not become a house; it becomes a house work in progress.
Knowledge points
Time delay in housing construction
Assuming construction is instantaneous
How do you model a production delay like building a house in System Dynamics?
Clear evidence
Shown in the video
Evidence
Audio
Observation
Explanation of WIP and completion time.
Knowledge points
Representing Delays with Stocks
Stock and Flow Model Structure
What variables determine the 'Gap' in the housing model?
Clear evidence
Shown in the video
Evidence
Audio
Observation
Calculation of gap using 10,000 and 1,000.
Knowledge points
Stock and Flow Model Structure
How do you calculate the monthly decay rate if the average lifetime is 36 months?
Clear evidence
Shown in the video
Evidence
Audio
Observation
Explanation of dividing stock by 36 months.
Knowledge points
Time Constant Formulation
Derivation of Monthly Decay Rate
Why is a 36-month lifetime equivalent to a1/36 monthly decay rate?
Clear evidence
Shown in the video
Evidence
Audio
Observation
Statement about mathematical equivalence.
Knowledge points
Equivalence of Average Lifetime and Decay Fraction
Counter-intuitive Nature of Fractional Decay
What is a stock-and-flow diagram?
Clear evidence
Shown in the video
Evidence
Audio
Observation
'So that is a stock and flow diagram...'
Knowledge points
Stock-and-Flow Diagram
How do time delays affect system dynamics models?
Clear evidence
Shown in the video
Evidence
Diagram
Observation
Annotations showing '3 months' and '30 months'.
Knowledge points
Time Delays in System Dynamics
How does a system adjust its behavior to reach a specific goal?
Clear evidence
Shown in the video
Evidence
Audio
Observation
'...as the system tries to reach 10,000 houses.'
Knowledge points
Goal-Seeking Behavior
Coverage and review notes
Covered · Lecturer introduces the need to account for construction delay in the housing model.
Covered · Lecturer explains work in progress and the two-stock chain representation of delay.
Covered · Lecturer revises the whiteboard diagram by relabeling Houses as House WIP and adding Completing houses.
Covered · Full segment covers the addition of the Finished Houses stock, rewiring the Gap calculation, and defining the completion rate based on WIP and delay time.
Covered · Review of existing model components and completion rate calculation.
Covered · Introduction and drawing of the scrap/decay flow and its time parameter.
Covered · Mathematical derivation of the decay rate and discussion of its equivalence to average lifetime.
Covered · Entire clip presents a static whiteboard diagram while the speaker introduces the concept of using this stock-and-flow model to analyze delays and goal-seeking behavior.
Reviewed English material v1: knowledge_item/definition "Stock and Flow Model Structure" from 2:00 to 4:00 — The system is modeled using stocks (accumulations) and flows (rates of change). 'House WIP' accumulates via 'Building houses' and depletes via 'Completing houses'. 'Finished Houses' accumulates via 'Completing houses'. Stocks represent quantities at a point in time.; Flows represent rates of change over time.